

This section contains the following topics:
Integration and Connector Tasks
How to Create a Syslog Listener
Create a New Integration Version
Exporting and Importing Integration Definitions
How to Configure Connectors in Bulk
Update Multiple Connector Configurations
An integration is a template for connectors. It includes all the components necessary for gathering event information from a specific type of source: a log sensor, XMP and DM files, and optional suppression rules. Integrations are supplied by CA. Users can also create their own integrations.
You can create a custom integration or modify a copy of a predefined integration. You can also create your own XMP or DM files for use in custom integrations, as well as saved integrations containing specific data access information.
After you analyze an event and create the required integration, you can create a connector, using saved configurations, and apply it to an agent, as shown in the following illustration:
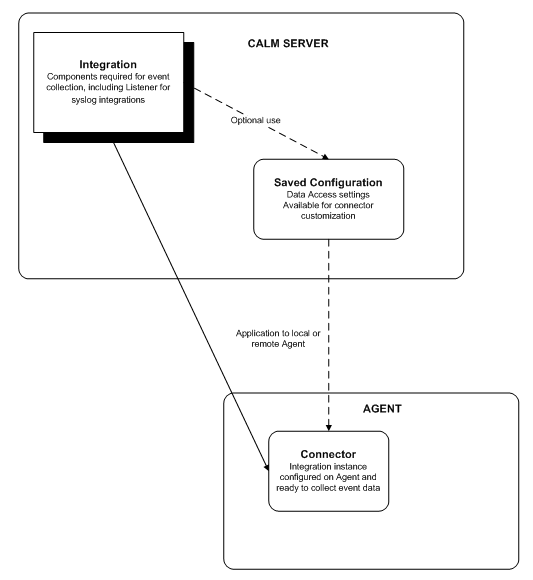
You can use the integration wizard to create or edit integrations, which serve as templates for the configured connectors that gather or receive events from your environment.
You can create integrations of several types, including WMI and ODBC integrations, which actively gather events of their specified type. You can also create syslog integrations, which receive events passively. Syslog integrations can receive events from more than one source. Therefore the process of creating a syslog integration and connector is slightly different.
To take full advantage of this advanced feature, you need a thorough understanding of the event sources in your environment and their communication types. In addition, you need a thorough understanding of regular expression syntax, the CEG, DM and XMP files, and how they parse events.
Creating an integration includes the following steps:
You can also create a custom user integration by copying a subscription integration.
To create a new integration or edit an existing one, open the integration wizard.
To open the integration wizard
Integration buttons appear in the details pane.
The integration wizard appears.
When using the wizard:
When you can create an integration, you set key integration details, such as the log sensors, XMP files, and DM files that are used to collect events.
To add integration components
Defines the log sensor the integration uses to read events from the log source.
Defines the helper binary the integration uses to connect to the selected log store. Most integrations do not require a configuration helper.
Refers to the operating system the integration agent is able to run on, not the operating system of the application the integration is designed to monitor. The wizard automatically selects the operating system based on your sensor and configuration helper settings.
If you click Save and Close, the new integration appears in the user folder list, otherwise the step you choose appears.
You can apply both suppression and summarization rules to an integration to streamline event refinement. When the integration is configured as a connector, suppression and summarization rules are applied before being sent to the event log store. The suppression and summarization check is in addition to the suppression and summarization check made at the event log store.
For example, you can apply a suppression rule so that unwanted Windows events are not sent to a WMI agent. Network traffic is reduced and these events never reach the event log store.
Important! Create and use suppression rules cautiously because they prevent the logging and the appearance of certain native events entirely. We recommend testing suppression rules in a test environment before deploying them.
To apply suppression and summarization rules
If you click Save and Close, the new integration appears in the user folder list, otherwise the step you select appears.
You can control integration data access settings using default configurations. For example, you can set the domain controller to connect to for WMI communications.
This step does not apply when creating a syslog integration, because syslog integrations inherit their configuration values from the syslog listener.
To set default configurations
If you click Save and Close, the new integration appears in the user folder list, otherwise the step you select appears.
You can control data access settings for integrations using the file log sensor. You can use the CA Technologies-provided default settings for most event collection purposes, but you may want to alter these settings for custom integrations.
To set file log configurations
Defines the threshold, in events, at which an anchor value is created. If event processing is interrupted, the agent refers to the latest anchor to begin reprocessing. Setting a lower anchor rate reduces the chance of lost events, but affects performance since the anchor value is created more often. Setting a very high anchor rate increases workload, since many events would be reprocessed in the event of a processing interruption.
Default: 4
Controls whether the agent will begin reading the file from the beginning if event processing is interrupted. If the check box is not selected, the agent will resume reading events using the anchor rate. If the check box is selected the sensor reads the log file from the beginning when you deploy a connector for the first time. Depending on the size of the database and the rate of event generation, the CA User Activity Reporting Module log sensor may take some time to synchronize with real-time events.
Defines the path where the log file is saved after rotation. The archive directory and the directory name can be the same.
Sets a text string used to identify the event source log file. The file mask can use wildcards. For example, to identify a log file named "messages.txt", you could enter the mask messages* .
Sets the integration to correspond with the file rotation type used by the product from which it receives events. The actual rotation type is set by that product. The following settings are supported by CA User Activity Reporting Module integrations:
Defines the path for the event source log file.
Defines the regular expression that separates individual log entries in a multi-line log file. Each time the log sensor locates the specified delimiter, it begins reading for new events. This allows CA User Activity Reporting Module to receive multiple event entries from a single log file. For example, if each log file entry contains a unique time/date stamp, you could use the regular expression for that timestamp format as the delimiter.
An additional set of configuration value fields appear, allowing you to enter values for event collection from a different event source.
If you click Save and Close, the new integration appears in the user folder list, otherwise the step you choose appears.
You can use the listener wizard to create or edit syslog listeners. The listener controls how syslog events are routed to the CA User Activity Reporting Module server.
Note: You can use the subscription (pre-defined) syslog listener for almost all purposes. Certain users may want to adjust their syslog reception by using custom listeners, and these instructions are included for their purposes.
To take full advantage of this advanced feature, you need a thorough understanding of the syslog event sources in your environment.
Creating an integration includes the following steps:
To create a new syslog listener or edit an existing one, open the listener wizard.
To open the listener wizard
The Log Collection folder list appears.
Integration buttons appear in the details pane.
The listener wizard appears.
When using the wizard:
To create a syslog listener, set details such as a name and configuration helper.
To add listener components
Defines the helper binary the integration uses to connect to the selected log store. Most integrations do not require a configuration helper.
Note: The sensor type for a listener is always syslog.
If you click Save and Close, the new integration appears in the user folder list, otherwise the step you select appears.
You can apply both suppression and summarization rules to a syslog listener to streamline event refinement. When the listener is used with a connector, incoming events are verified against any applied suppression and summarization rules before being sent to CA User Activity Reporting Module.
For example, if you wanted to create a listener to receive CA Access Control events only, you could apply the CA Access Control successful file access rule. You avoid excess processing because only needed rules are used to verify incoming events.
Important! Create and use suppression rules cautiously because they prevent the logging and the appearance of certain native events entirely. We recommend testing suppression rules in a test environment before deploying them.
To apply suppression or summarization rules
If you click Save and Close, the new listener appears in the user folder list, otherwise the step you select appears.
You can control syslog listener data access settings using default configurations. For example, you can set trusted hosts or default communication ports.
To set default configurations
Helps ensure that events are sent to the event log store in the same order in which they are received. If event ordering is disabled, the order can be changed if some events are parsed and sent onward more quickly than others. Enabling event ordering can affect performance by slowing event processing and submission.
Defines the number of processing threads for each protocol. Using many processing threads speeds processing if event ordering is disabled. If event ordering is enabled, the thread count has no effect. Using many threads can affect performance.
Sets the size of the queue, in number of events, for incoming event information. The queue is used to process and submit events. If the buffer is filled no further events can be received until processed events make room.
Sets the ports the listener uses to receive events through UDP or TCP. If you specify multiple ports, the service tries to bind to each in turn. The syslog default ports are already set. If you have routed syslog events to other ports, set your CA User Activity Reporting Module reception ports accordingly.
Important! If the agent is running as a non-root user on a UNIX system, change the syslog listener ports to port numbers above 1024. In this case, UDP port 514, the default, is not opened and no syslog events are collected.
Defines trusted IP addresses for IPv4 or IPv6 - only communications from a trusted host are accepted. If you specify no trusted host, events from all available syslog event sources are accepted. Enter the exact IP address, as recorded in the event_source_address field for trusted hosts. You cannot use wildcards or subnet addresses.
Lets you add time zones for syslog event source computers. syslog does not typically record time. Identify the source systems by full IP address and time zone to receive and adjust events from syslog sources that are in a different time zone than the CA User Activity Reporting Module server. Do not list syslog sources in the same time zone as the server.
If you click Save and Close, the new listener appears in the user folder list, otherwise the step you select appears.
Add a time zone for one or more syslog event source computers to receive and correctly adjust events from syslog sources that are in a different time zone than the CA User Activity Reporting Module server.
You can add a syslog time zone when creating an integration, when configuring a connector, or when creating a saved configuration.
Note: When adding a time zone to an environment where daylight savings time applies, be sure that a matching time zone entry exists on the agent host system. Without such an entry, the syslog time zone is unable to process the daylight savings time change, and events show an incorrect time stamp during the daylight savings period.
To add a syslog time zone
The syslog time zone interface appears.
A new time zone folder appears in the list area, and a time zone drop-down list appears in the right pane.
The zone you select appears next to the folder.
The folder expands, showing a single untitled event source computer for that time zone.
The IP address entry field appears.
The address appears next to the computer icon as you type.
The folder closes. Open it to display a new untitled event source computer. Go to step 6.
A new untitled time zone folder appears. Go to step 3.
You can create a new version of an existing user-created (custom) integration.
To create a new integration version
The new integration version appears in the list.
You can delete a custom integration. You cannot delete a subscription integration.
To delete a custom integration
A confirmation dialog appears.
The integration is removed from the list.
You can export and import integration details for use in other management servers. This lets you transfer successful custom integrations between CA User Activity Reporting Module environments, or from a test to a live environment.
You can import integration definition XML files for use in the local management server.
To import integration details
The Log Collection folder tree appears.
An Import File dialog opens.
The query files are imported to the current folder, and a confirmation dialog appears.
You can export integration details for use in other management servers. The export is saved as an XML file.
To export integration details
The Log Collection folder tree appears.
A download dialog appears.
The query files are saved to your chosen location, and a confirmation dialog appears.
You can create a connector to gather events from a specific operating system or device in your environment. You use an integration or a listener as a template to create a connector, using the new connector wizard. Each new connector is applied to an agent in your environment.
You can create connectors of several types, including WMI and ODBC integrations, which actively gather events of their specified type. You can also create syslog connectors which receive events passively. Syslog connectors can receive events from more than one source, unlike the other types. Therefore the process of creating a syslog connector is slightly different.
The process of creating a connector has the following steps:
To create a new connector or edit an existing one, you must open the connector wizard.
To open the connector wizard
The Log Collection folder list appears.
The agents belonging to the group you selected appear.
Agent management buttons appear in the details pane.
The connector wizard appears.
When using the wizard:
You can add a name and description to identify your connector. You must also choose the integration you want to use as a template for the connector.
To add connector details
The wizard opens displaying the Platform and Platform Version for the current agent at the top of the screen.
If you click Save and Close, the connector appears in the connectors list.
When creating or editing a connector, you can select suppression and summarization rules to apply to events handled by the connector. Any suppression or summarization rules you add are applied before the events are transmitted to the CA User Activity Reporting Module server.
To apply suppression or summarization rules
A list of available suppression rules appears.
If you click Save and Close, the connector appears in the connectors list.
When creating or editing a connector, you can set individual configurations, which determine how the connector receives and transmits events. You can either set the configurations for each connector, or use saved configurations.
Saved configurations are collections of data access settings that you can reuse. You can apply saved configurations to multiple connectors.
To set connector configurations
The connector appears in the connectors list.
When creating or editing a connector, you can throttle the CPU usage of the connector. The CA User Activity Reporting Module logsensor starts receiving events based on the allocated CPU usage.
Important! We recommend that you do not set a CPU throttle percentage above 80 percent as higher values affect the performance of CA User Activity Reporting Module.
Follow these steps:
Note: By default, CA User Activity Reporting Module displays the number of CPUs configured during the installation.
The connector appears in the connectors list.
Note: CA User Activity Reporting Module requires a minimum of five minutes to implement the changes to the CPU usage.
You can open the connector list for each agent to view and edit connectors attached to that agent.
To view a connector
The Log Collection folder list appears.
The Agent Connectors list appears, displaying the connectors deployed on the selected agent.
You can view a guide containing setup and configuration information for each type of CA User Activity Reporting Module connector. The guide contains instructions on how to configure the target product and the connector itself to receive events.
It also contains reference information such as connector log names, and what types of events the connector transmits to CA User Activity Reporting Module.
To view a connector guide
Integration details appear in the right pane.
The connector guide for that integration appears in a new browser window.
You can edit an existing connector. Editing a connector creates a new version.
To edit a connector
The Log Collection folder list appears.
The Agent Connectors list appears, displaying the connectors deployed on the selected agent.
The connector wizard opens, displaying the selected connector.
The edited connector appears in the list.
A saved configuration is a re-usable collection of settings that allows a connector to collect events from a device or log source. You can use saved configurations to allow a degree of customization without requiring the creation of an entirely new integration.
Configurations differ by integration type. For example, you can save trusted hosts for a syslog connector, or WMI server contact information for a WMI connector.
Saved configurations let you retain this grouped information and apply it to multiple connectors. Since each saved configuration is associated with a particular integration, you can only use a saved configuration on connectors that use that integration.
You can create a saved configuration, associating it with a specific integration.
To create a saved configuration
The Log Collection folder list appears.
The integration details appear in the details pane.
The Saved Configurations List appears.
The Saved Configuration dialog appears, displaying the default configuration values for the selected integration.
A confirmation message appears
The saved configuration appears in the list.
You can configure event collection sources by creating multiple connectors in bulk. You can create multiple connectors at the same time, using the same integrations, and deploy them on various agents in your environment.
The configuration process includes selecting event sources, applying suppression rules, applying summarization rules, and setting connector configurations. Before you can take advantage of this feature, create a list of identification information such as hostnames and IP addresses for the event sources you want to configure. The list must be in comma-separated value (.csv) format.
The process of configuring collection sources, using the bulk connector deployment wizard, has the following steps:
To create connectors on agents, you can use the bulk connector deployment wizard.
To open the bulk connector deployment wizard
The Log Collection folder list appears.
The configure collection sources wizard appears.
When using the wizard:
Select source details, and identify which integration to connect to which event sources. You must have a list of required event source details in a .csv file to complete this step.
Note: The .csv file contains the information that is required to create the connectors. Each column in the .csv file identifies a connector configuration field, and contains values for that field. For example, you can have an IP Address column that lists the IP addresses of hosts from which you want to receive events.
The How to Create an Integration section contains specific configuration fields by log sensor type.
Follow these steps:
The first 100 rows of the collection source file you select appears in the Source File Contents area for review. The first row is set as the column header row, and remains as the header even if you adjust the sample size in step 5.
The portion of the collection source file you select appears in the Source File Contents area for review. Column headers are not affected by changing the From Row to a value greater than 1.
You can select which suppression rules to apply to your bulk configuration change.
To apply suppression rules
Note: You can search for suppression rules using the Suppression Rules Pattern field.
You can select which summarization rules to apply to your bulk configuration change.
To apply summarization rules
Note: You can search for suppression rules using the Summarization Rules Pattern field.
You can set the connector configurations for your bulk connection creation. Each connector you create shares the configurations you set in this step, using either the sources that you collected from the .csv file in Step 1, or Saved Configurations.
To set connector configurations
The page displays the Source Fields you set in step 1. Each header column from the source file appears as a source field. The page also displays default sensor configurations for your chosen integration in the Sensor Configuration area.
For example, your source list contains a UserName column. Drag it into the User Name Sensor Configuration field, if one exists for the sensor type you are configuring.
You can select the agents where you want to create the connectors you have configured. Map the event sources you selected in Step 1 to the agents you want to target for connector deployment.
To select agents and map sources
The page displays a list of sources based on the sources you uploaded in Step 1. Each source is numbered in row order, so Source 1 represents the first row you specified in your source list.
Connectors based on the sources you select are configured on the selected agents.
You can update multiple connectors that use the same log sensor by changing one or more of the default configurations. For example, you could change the log file rotation type on multiple connectors using the log file sensor.
To update multiple connector configurations
The Update Connectors wizard appears, displaying the Select Connectors page.
A confirmation message appears.
|
Copyright © 2014 CA Technologies.
All rights reserved.
|
|