

You can upgrade existing CA User Activity Reporting Module servers and agents for FIPS support using the Subscription Service. This upgrade process assumes the following:
Use the following process to upgrade your servers:
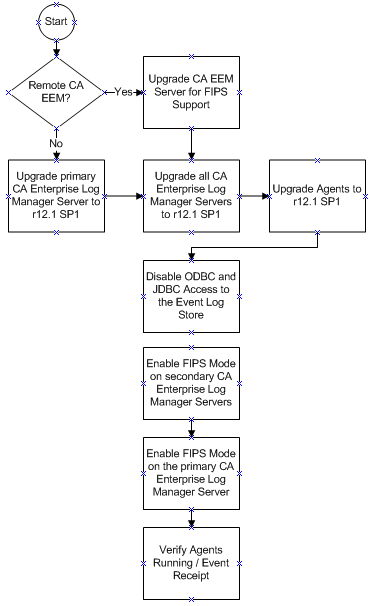
The upgrade and FIPS enablement process includes the following steps:
Important! If you deployed a connector that uses the syslog log sensor on a Windows host, update all of these connector configurations to use the latest syslog sensor for this release, when running in FIPS mode. Refer to the CA User Activity Reporting Module Product Integration Matrix for the latest list of integrations that use the syslog log sensor.
Agents automatically detect the operating mode from the CA User Activity Reporting Module server that manages them.
You can also verify that the agents are sending events using a query or report, or by examining the self monitoring events tab in the System Status Service area.
When you upgrade an existing agent to r12.1 SP1, the subscription processing updates the agent in non-FIPS mode by default. You set the FIPS mode for the CA User Activity Reporting Module server that manages an agent. An agent detects the FIPS mode of its managing server and restarts itself in the corresponding mode as needed. Use the Agent Explorer dashboard in the CA User Activity Reporting Module user interface to view the FIPS mode for an agent, if you have Administrator user privileges.
The following are prerequisites for upgrading CA User Activity Reporting Module to support FIPS 140-2:
The following guidelines apply to upgrading to CA User Activity Reporting Module with FIPS support:
Important! Do not switch to FIPS mode on any secondary CA User Activity Reporting Module server during subscription processing. This can cause subscription processing to fail.
If you are using a stand-alone CA EEM server with your CA User Activity Reporting Module installation, upgrade it for FIPS support before upgrading any of your CA User Activity Reporting Module servers or agents. See the instructions in the CA EEM Getting Started guide for details and instructions.
You can prevent ODBC and JDBC access to the events in the event log store using options in the ODBC Service configuration dialog. If you plan to run your federated network in FIPS mode, disable the ODBC and JDBC access to remain in compliance with federal standards.
To disable ODBC and JDBC access
Note: Disable the ODBC option for each CA User Activity Reporting Module server in a federation to verify that ODBC and JDBC are disabled.
You can use the FIPS Mode options in the System Status service to turn FIPS mode on and off. The default FIPS mode is non-FIPS. Administrator users must set the FIPS mode for each CA User Activity Reporting Module server in a federation.
Important! You cannot operate with mixed modes within the same federation of servers. Any server in a federation running in a different mode is not able to gather query and report data, or respond to requests, from the other servers.
To switch between FIPS and non-FIPS modes
The System Status Service Configuration dialog appears.
The CA User Activity Reporting Module server restarts in the selected mode. You can log in again to view agent FIPS mode from the Agent Explorer.
You can also use self monitoring events to verify that the CA User Activity Reporting Module server started in the desired mode. Look for the following events in the Self Monitoring Events tab in the System Status dialog:
Successfully turned Server FIPS mode ON
Successfully turned Server FIPS mode OFF
Failed to turn Server FIPS mode ON
Failed to turn Server FIPS mode OFF
Disabling FIPS mode for the primary or Management server stops all federated queries and reports returning data. In addition, scheduled reports do not run. This condition continues until all servers in the federation are running in the same mode again.
Note: Disabling FIPS on the Management or remote CA EEM server is one of the requirements for adding a new CA User Activity Reporting Module server to a federation of server running in FIPS mode.
You can view the agent dashboard to view the status of agents in your environment. The dashboard also displays details such as the current FIPS mode (FIPS or non-FIPS), and usage details. These include events per second load, CPU percentage use, and most recent update date and time.
To view the agent dashboard
The Log Collection folder list appears.
Agent management buttons appear in the details pane.
The agent search panel appears, displaying status for all available agents in a details chart. For example:
Total: 10 Running: 8 Pending: 1 Stopped: 1 Not Responding: 0
A list of agents meeting your search criteria appears, displaying information including:
|
Copyright © 2014 CA Technologies.
All rights reserved.
|
|