

Fabric Full-Path Analysis is a utility that lets you query SAN fabric and obtain information about the connectivity between fabric objects that are registered with CA SRM. Fabric Topology defines how different elements of SAN fabric are connected.
Fabric topology treats the entire fabric as a collection of elements with possible links between some of the elements. Use the Full-Path Analysis utility to query and identify the complete path from a source to a target (or target to a source).
The full path analysis presents the fabric elements and their connectivity information as an undirected Graph G = <V, E>, where V = nodes and E = edges. The nodes represent the fabric elements and edges represent the connectivity. An articulation point is a vertex whose removal disconnects the graph.
The full path data analysis helps an administrator to assess the risks that are associated with the data paths and identify their articulation points. The full path data analysis provides fabric connectivity information. An administrator can query the connectivity information to know how specific elements of the fabric are connected. The administrator uses this information to perform following tasks:
Based on these reports, an administrator can improve performance and availability of SAN fabric.
The full path analysis performs a rule-based traversal of the graph and the resulting paths are displayed in an output window.
The following elements are available in a fabric:
Important! The indentation specifies a parent-child relationship among the objects of the model.
Switch Model
Disk Array Model
Host Model
Storage Volume Controller Model
Virtual Host Server Model
NETAPP Model
As a Storage Administrator, your responsibilities include monitoring each storage device to help improve the network and application availability.
The following diagram illustrates how a Storage Administrator queries SAN fabric using fabric topology and how to use the query result to analyze the report and improve performance.
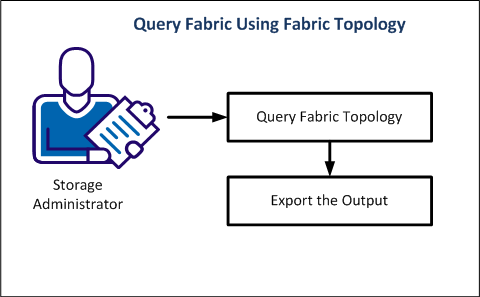
You can query fabric topology to get the full path data analysis which helps you improve the performance of SAN fabric.
Follow these steps:
The CA SRM Fabric Full path Analysis dialog opens.
The list of elements displays.
The list of elements displays.
You can exclude the switch ports when you want only the switch names in a path. In such scenarios, you select the exclude objects option.
Selecting this option lets you view the physical path that are in an active zones.
Note: The Enforce Zoning option is applicable only when you select the All Physical Paths option.
Selecting this option displays the physical paths traversing through SVC.
Example: If there is a path from Host to Disk Array through SVC, then the paths from Hosts to SVC and paths from SVC to Disk Array are shown disjointly. Combining these paths increase in the number of paths.
Selecting this option displays all the possible physical connections (both active and inactive paths) between selected source and destination objects.
Note: If you select the Show Paths Via SVC and All Physical Paths check boxes, these paths break up at each SVC to avoid exponential growth of the number of paths.
Note: You can select one of the three options. You can either select the Longest Path, Shortest Path, or None. The length of the path is the number of elements along the path.
Longest Path
Defines the path of maximum length in a given graph.
Shortest Path
Defines the shortest paths between every pair of vertices v, v' in the graph.
None
Defines all the paths in the graph.
The system displays the query result.
Understand the parent-child relationship between elements in SAN fabric to query for analysis. Following examples help you get acquainted with the fabric topology.
Example: Host to Switch
A host can be connected to a switch either directly or indirectly through another switch. A path from host to a switch typically looks like:
Host->Physical Disk->Host Port->Switch Port->Switch
If ISLs are involved in the path, the path would look like:
Host->Physical Disk->Host Port->Switch Port->Switch->Switch Port->...->Switch
If you select multiple Hosts or Switches, paths are displayed from each source object to each destination object.
Example: Disk Array to Switch
A disk array to switch can be either direct or through other intermediate switches. The following example shows the path between a disk array and a switch.
Disk Array->Disk Array Port->Switch Port->Switch
If they are connected through ISLs, those ISLs are also displayed.
Note: When you select multiple source objects and multiple destination objects, all paths from each source to each destination are displayed. If you select a Host and its Physical Disk for querying, you can find multiple paths. Some paths pass from the Host and some other paths pass from the Physical Disk, while the Host Paths pass through the Physical Disk.
When you query fabric using fabric topology, you get one of the following paths as output in the query result.
These represent the physical connectivity amongst the elements. By default, the active physical paths are displayed only when there is a logical connection between the selected source and destination objects.
The paths may display in Green / Black colors. Green paths are physically connected paths that are in the active zone. Even if one of the elements of the path is not in active zone, the path displays in black color.
Note:
Logical paths are paths that contain no switch elements in between. In logical paths, the physical disk of the host is connected directly to the logical device on the disk array, without any mention of the intermediate elements. These paths display when the path is from an initiator element to a target or a target to an initiator element.
Example: You query for a path from an application (on host, therefore initiator) to a disk array. Another example could be a disk array to a host selection. These are full paths. In such cases, both the physical paths as well as the logical paths are displayed.
You can export the output of the query for further processing. The output can be in CSV or XML formats which can be used as input to other custom programs for further processing. You can analyze these reports and can identify improvements to the performance and availability of fabric.
Follow these steps:
The Save As dialog opens.
The output is saved to the selected format (CSV or XML).
A full path connects a source to a target. Full path analysis provides you with varied information to identify and improve the availability of fabric such as, the Luns that can be mapped for better performance of fabric.
The full path analysis helps you assess the risks that are associated with the data paths and identify their articulation points. Based on these reports, you can improve the performance and availability of SAN fabric.
|
Copyright © 2016 CA Technologies.
All rights reserved.
|
|