

Manage your disk arrays by performing the following tasks:
You can customize and generate various reports on SAN storage utilization using the user views. These reports helps you in identifying the disks in your array that are most vulnerable and which contains the most valuable data.
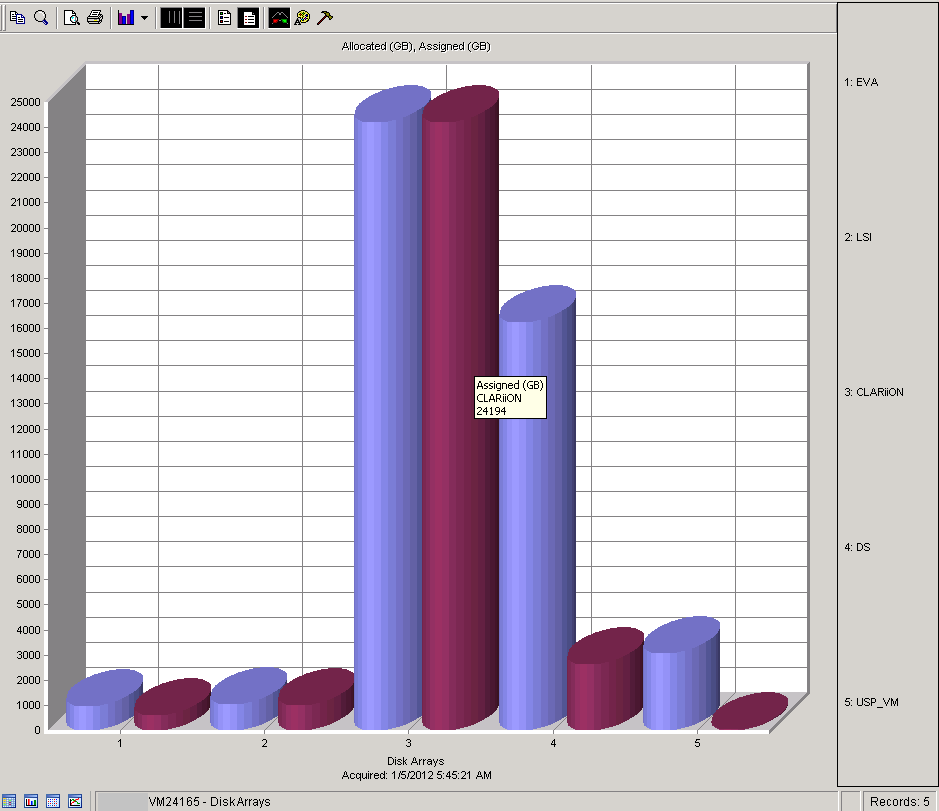
A sample report (with the graph and trending information) created for each of the disk array objects are provided from the object tree.
Follow these steps:
The grid opens on the right pane.
The graph displays the allocated and assigned utilization of registered disk arrays.
Follow these steps:
The grid opens on the right pane.
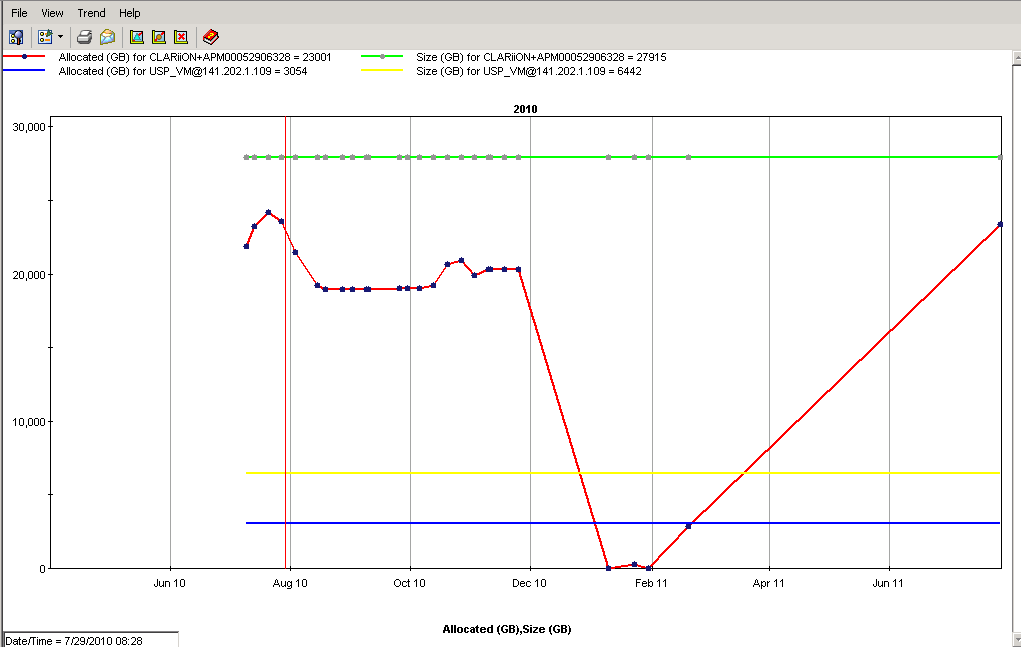
The trend provides the total size and the allocated size of registered disk arrays over a time.
You can export these reports to Excel, HTML, PDF, TXT, .MDB, and Web Document formats. Thus, you can customize and generate SAN reports. These reports help you in identifying the disks in your array that are at risk and contains the most valuable data.
|
Copyright © 2016 CA Technologies.
All rights reserved.
|
|