

This report gives an overview of how storage capacity is utilized, and how it is allocated across the enterprise.
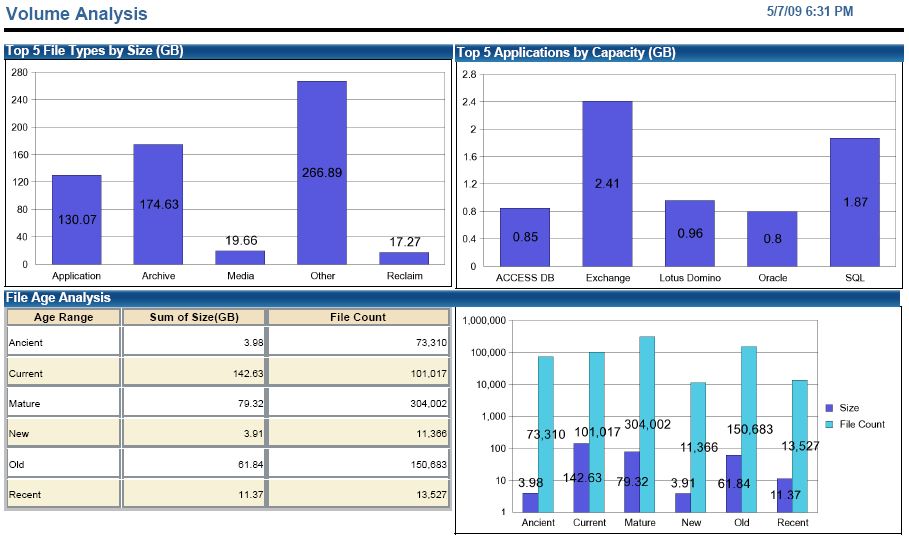
This table shows the top-five file types by size based on the file groups defined in CA SRM.
This bar chart shows the top-five applications using the most storage. The applications listed are the databases and messaging systems supported by CA SRM, as well as User Defined Applications.
This table shows the file data grouped by the last access date and listed by count and sum total of the size. The supporting bar chart graphically shows the same information.
This table shows the top-ten users by storage consumption and file count used.
This table shows where all of the storage is located and lists each server, its volume, whether or not it is SAN attached, the volume size, available space, occupied space, and manufacturer.
|
Copyright © 2013 CA.
All rights reserved.
|
|