

Use the Y‑axis Scale tab to set the Y‑axis scale minimum and maximum values. The following example shows the Y‑axis Scale tab:
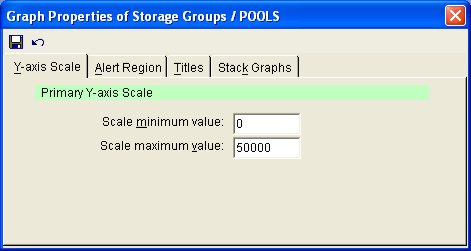
The following options are available on the Y-axis Scale tab:
Enter the lowest relevant value for your graph.
Enter a value that will somewhat higher than the highest anticipated value.
|
Copyright © 2013 CA.
All rights reserved.
|
|