
Measuring SiteMinder performance is an iterative process that involves gathering metrics that reflect how different components of your deployment are performing. We recommend measuring round–trip times between each pair of components to determine if performance standards are being met and to identify potential bottlenecks.
Note: Avoid using traditional performance metrics, such as CPU usage, as the sole determining factor for tuning a SiteMinder deployment. For example, the system hosting the Policy Server can be running at low CPU usage under load, but this factor does ensure that the Policy Server has reached optimal performance.
Tools you can use to measure SiteMinder performance include:
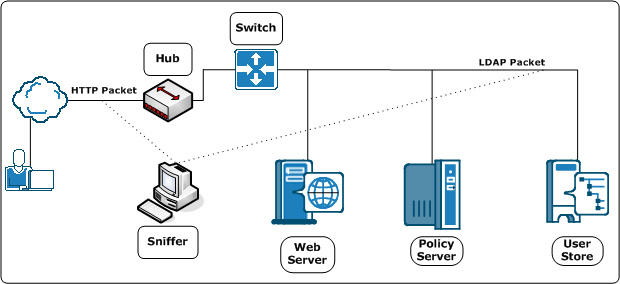
You can use third-party network sniffers to gather insight into the size and content of a request for unencrypted data without affecting test results. Sniffers can also provide alerts to extra packets being sent, long delays between load balancing, and redirection technologies that logs alone cannot capture.
Note: If the network is set up on a switched hub configuration, place the sniffer between the client and the server on the client–side hub.
The following diagram illustrates a network sniffer in a standard SiteMinder deployment.

You can use the SiteMinder OneView Monitor to identify performance bottlenecks and gather metrics about resource usage in a SiteMinder deployment. The OneView Monitor also displays alerts when certain events, such as component failure, occur by collecting operational data from the following SiteMinder components:
The OneView Monitor can identify performance bottlenecks between SiteMinder Agents and the Policy Server by providing metrics such as:
Note: For a complete list of the data types the OneView Monitor can provide, see the Policy Server Administration Guide. For more information about installing the OneView Monitor, see the Policy Server Installation Guide.
You can use the SiteMinder Test Tool utility to test the interaction between SiteMinder Agents and a Policy Server. The Test Tool emulates a Web Agent, which lets you isolate Policy Server performance.
The Test Tool can perform three types of tests:
Tests policies to be sure that they are configured correctly.
Tests whether changes, such as migrating a policy store or implementing a new feature, affect the deployment.
Test the performance of a Policy Server as it receives multiple requests.
Note: For more information about the Test Tool utility, see the Test Tool Help.
You can use directory server utilities to simulate Policy Server requests to the directory server or database to isolate query lags. You can also use SQL analyzers to analyze response times between the Policy Server and user directories.
|
Copyright © 2012 CA.
All rights reserved.
|
|