

As a system administrator, you gather information about your installation environment, resource usage, configuration details, and other available system resources. For example, understand the computer configuration to determine the Operating System type, version, and available system resources. This data helps you to identify and diagnose a performance or memory-related issue in CA SDM. The CA Diagnostic Report tool and the Interval Logging utility helps you collect diagnostic information about your CA SDM environment.
The following diagram describes how to gather diagnostic information and identify performance problems in CA SDM:
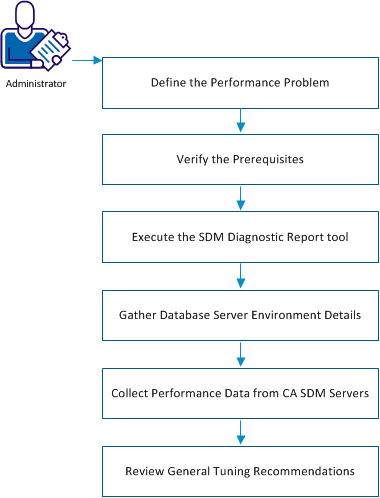
Follow these steps:
Note:
We recommend that you contact CA Support Online before you use the diagnostic tool.For a Windows installation, install the pslist.exe tool and add its directory path variable to the system path variable .
Follow these steps:
psexec.exe -s -i pslist.exe
Note: You can start the CA SDM Windows service under a different user account other than the Local System account. For that service, execute pslist.exe under that account and accept the license agreement. If pslist.exe is added after installing & configuring CA SDM, restart the CA SDM services after accepting the license agreement of pslist.
You can define your performance problem by collecting the system information initially. Review the following list of example questions to determine if they are relevant for your issue:
As a best practice, we recommend you to monitor the key performance indicators and the resource consumption regularly. Also, ensure that routine maintenance is applied to identify small problems before they become serious.
If you suspect an issue, or users complain about slow performance, open a CA Support Online issue and send the Interval Logging data, CA SDM Diagnostic Tool Report, CA SDM standard logs, and information about the problem. Send the information to CA Support from each CA SDM server.
The following list describes common signs of performance problems:
Note: Execute pdm_webstat to display the number of concurrent users per web engine. You can execute this command at the OS prompt manually. The Interval Logging script also executes this command.
You can gather details about your database server to help identify performance problems in CA SDM.
Follow these steps:
select @@version
SELECT SERVERPROPERTY('productversion'), SERVERPROPERTY ('productlevel')
select * from v$version where banner like 'Oracle%';
For example, locate information about the products from available PDF files or diagrams.
The CA SDM installation media includes the Diagnostic Report Tool to help collecting information for diagnosing performance problems. You can use the diagnostic tool to collect information regarding the type of operating system, and to determine what commands to use for the data collection from the CA SDM installation.
Configure the CA SDM server before running the diagnostic tool.
Follow these steps:
The default for $NX_ROOT is the C:\Program Files\CA\Service Desk\ on Windows. You can change the default when you want to change the default directory during the installation process.
The default for $NX_ROOT is — /opt/CAisd/ on a Unix or Linux operating system. You can change the default when you want to change the default directory during the installation.
The CA Diagnostic tool creates a .CAZ file on the Windows OS and .tar.gz on UNIX in the $NX_ROOT\diag\rpt directory that you upload with your issue at http://support.ca.com.
Follow these steps:
The diagnostic tool can take five to 10 minutes to complete.
Note: If you want to cancel the background batch job, use CTRL-C to cancel the batch file. Some processes still run in the background, such as MSINFO32.exe. If you have any questions about using this diagnostic tool, contact the CA Support Online.
$NX_ROOT\diag\bin\cazipxp -u <package_name>.CAZ
gunzip -d <package_name>.tar.gz
tar -xvf <package_name>.tar
The following list describes the Windows report files that are created and included in the CAZ\tar file package.
Specifies the CA licensing information from ca_lic directory.
Specifies the log file that is related to CA licensing from ca_lic directory.
Specifies the log file that is related to CA licensing from ca_lic directory.
Specifies the file that is related to CA licensing from ca_lic directory.
Specifies the Dr Watson configuration of the computer.
Specifies the environment variables that are set on the computer.
Specifies the output of slstat command.
Specifies the output of slstat command.
Specifies the Service Desk install directory listing.
Specifies the process listing when the pslist Microsoft tool is installed.
Specifies the MSINFO output gathering system information.
Specifies the system information.
Specifies the application event logs created in the past seven days.
Specifies the application event logs created in the past seven days.
Specifies the computer information.
Specifies CA products installation information.
Specifies the Registry information of installed CA products.
Specifies the list of software features that are installed for Service Desk.
Specifies the IP configuration information.
Specifies the log created for running the supp_diag tool.
The following list describes the UNIX report files that are created and included in the CAZ\tar file.
Specifies the CA licensing information from ca_lic directory.
Specifies the log file that is related to the CA licensing from ca_lic directory.
Specifies the environment variables that are set on the computer.
Specifies the output of slstat command.
Specifies the output of slstat command.
Specifies the Service Desk install directory listing.
Specifies the process listing when the pslist microsoft tool is installed.
Specifies the output of uname operating system command.
Specifies the output of df operating system command.
Specifies the output of memory information.
Specifies the log created for running the supp_diag tool.
Specifies the output of prtconf operating system command on Solaris and the AIX computers.
Specifies the OS version and patches Information on Solaris computers.
Specifies the IP configuration Information on AIX computers.
The default CA SDM documentation file\directory list includes the following reports in the CAZ\tar file. Add files or directories that you include in the CAZ\tar file by placing it in the $NX_ROOT\diag\misc_logs directory.
You can collect resource usage data on the different CA SDM servers in a multiple server configuration to determine the problems that are experienced on each server. The collected data sets are used to analyze and troubleshoot any performance or memory-related issues in the CA SDM servers. The interval logging utility allows you to start or stop the diagnostic data collection using the CA SDM web interface. You can share the collected data set with CA Support Online to help identify and resolve the CA SDM server problems.
Interval logging utility runs on pdm_intrvlog_nxd daemon that collects log data from a server. The daemon automatically starts when a Service Desk server start.
To collect the resource usage data on the CA SDM servers, configure the server for interval logging. You can select the type of data you want to collect from each server, and also change the logging options for the servers at any point.
For example, if you select only the CPU usage option for a particular server, the utility will only collect CPU usage data on the server.
Follow these steps:
The Interval Logging Configurations List opens.
The Create New Interval Log Configuration page opens.
Specifies the server for which you want to collect the log data. Use the Search icon to view the list of servers you can configure for the interval logging.
Specifies the time interval during which the log data is collected for the server. For example, if the recurrence interval is set to 3 minutes, the log is collected for every 3 minutes.
Indicates whether the interval logging is enabled or disabled for the server. If enabled, interval log is collected for the server.
Note: To stop the interval logging before the scheduled end date, change the Enabled status to NO.
Indicates whether the interval log configuration is active or inactive.
Specifies the start date and time for collecting the log data. If you do not enter a start date, interval logging starts immediately until the configuration is active and enabled or until the scheduled end date.
Specifies the end date and time for collecting the log data. If you do not enter an end date, interval logging will continue to run until the configuration is active and enabled.
For example, select CPU Usage if you want to capture the log for CPU usage data.
Collect CPU usage statistics for the server by executing pslist –x on Windows, or “ps” on Unix. Depending on your configuration type, you can collect the diagnostic data on the following servers:
Collects memory usage data for the server by executing pslist –m on Windows, or “ps” on Unix. Depending on your configuration type, you can collect the diagnostic data on the following servers:
Collects information of all active connections and network statistics by executing netstat /b, or /a from the operating system. Depending on your configuration type, you can collect the diagnostic data on the following servers:
Collects application and services information for all tasks running on the server. Depending on your configuration type, you can collect the diagnostic data on the following servers:
Collects CA SDM sessions and user statistics for the web engine processes by executing the pdm_webstat command. You can collect the data for any CA SDM servers.
Collect information about all the CA SDM daemons or processes on the server by executing the pdm_status command. You can collect the data for any CA SDM servers.
Collects information of database record types by executing the db_report command. You can collect the data for any CA SDM servers.
Collects information related to the queued database requests by executing the pdm_vdbinfo command. You can collect the data for any CA SDM servers.
Collects information on active connections for the server by executing the pdm_listconn command. You can collect the data for any CA SDM servers.
Collects information about slump connections and processes by executing the slstat command. You can collect the data for any CA SDM servers.
The server is configured for the interval logging.
Important! The maximum limit of the output file size defaults to 30 KB. You can modify the file size by changing the @NX_LOGFILE_LIMIT value in NX_env file. If the generated output file exceeds the maximum file size limit, a new file is created with the suffix of 1. Files that are generated subsequently have the suffix of the number incrementally.
You can share the collected log data with CA Support to help identify performance problems in your SDM installation.
|
Copyright © 2013 CA.
All rights reserved.
|
|