

If an examination of the system overview reveals a CPU limitation, you can investigate the cause of the limitation in more detail using the CPU display. The following illustration is an example of the CPU display:
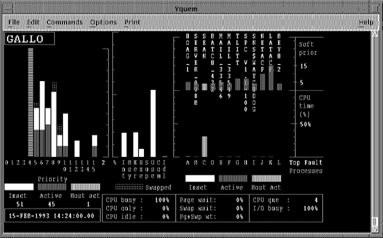
Examine the following CPU display indicators:
Look at the Idl bar (CPU Idle time) in the CPU mode bars in the middle of the CPU display. If there is no idle time, the CPU is a bottleneck.
The blocking high-priority process might be: running an inefficient program, acting as a server, or acting as a process with which other processes must communicate.
Look at the Priority bars for high-priority, active processes, or at the Process bars for high-priority processes with a high CPU time percentage. Corrective action might include changing process priorities in the user authorization file, defining priorities in the user login command file, or changing the priorities of processes while they execute.
Look at Page wait, Swap wait, and Pg+Swp Wt. CPU time might be lost because the CPU has to wait for disk transfers, or page or swap I/O to complete.
A high value of Pg+Swp Wt is cause for concern. It indicates a memory problem resulting in a CPU limitation.
Look at the CPU mode bars, Int (interrupt stack). A high value for Int might be cause for concern. Processes might be blocked from using the CPU because of too many device interrupts.
Use the ADVISE COLLECT SYSTEM command to collect system-wide PC samples and determine the system module usage (for example, the device driver); hence, the device(s) responsible for the excessive interrupts.
Look at the Ker (Kernel) and Exe (Executive) bars in the CPU mode bars. If time in Kernel mode is excessive and is not due to page faulting, or if time in Executive mode is excessive, use the ADVISE COLLECT SYSTEM command to collect system-wide PC samples, and determine the processes and system modules responsible.
Interrupt plus kernel CPU time should not be greater than 40 percent of total CPU time.
|
Copyright © 2008 CA.
All rights reserved.
|
|