

The CPU display contains CPU statistics for analyzing a CPU resource limitation in a cluster-wide manner.
An example of a resource CPU display is shown in the following table:
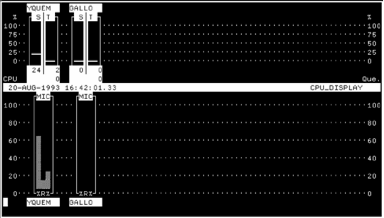
The top half of the CPU display contains a bar graph for each cluster node currently set for display. The scale shown at right and left shows a percentage value ranging from 0 to 100%.
The name of the node is given at the top of an individual node graph, while the average number of processes in the CPU queue for the node is shown as a number at bottom right. There is a real queue if this number is greater than 1. This number is equivalent to the sum of processes in the computable queue (COM). Each node graph has two columns as follows:
This column is headed by the letter S, and is a percentage value. The value is not only given by the column height, but is also shown as a number at the bottom of the column. The value is the percentage of the total CPU time used by the System (Interrupt stack, Kernel mode, Executive mode).
This column is headed by the letter T, and is a percentage value. The value is not only given by the column height, but is also shown as a number at the bottom of the column. The value is the percentage of the total CPU time used by user tasks (Supervisor, User, and Compatibility modes).
Note that the bottom value in this column is the average number of processes in the CPU queue. For a real queue to exist, this value must be at least 2.
|
Copyright © 2008 CA.
All rights reserved.
|
|