

The Disk display contains disk statistics for analyzing an I/O resource limitation in a cluster-wide manner.
An example of a resource Disk display is shown in the following illustration:
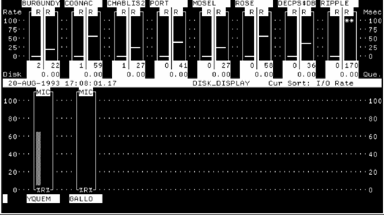
The top half of the disk display contains a bar graph for each disk currently set for display. The scale shown at right and left shows an absolute value ranging from 0 to 100. The scale at left is headed with the word Rate, while the scale at right is head Msec (Milliseconds). The rate scale is used with the leftmost column in the bar graph for a particular disk, while the Msec scale is used with the rightmost column.
The name of the disk is given at the top of an individual disk graph. Preceding the disk name is a number, which corresponds to the number assigned the disk when listing disk groups with the SHOW GROUP command. This number allows a partial disk name, as given at the top of each disk graph, to be associated with the full disk name as given by SHOW GROUP subcommand. The number of I/O packets in the disk queue for each disk is shown as a number at the bottom right of each disk graph. Each disk graph has two columns as follows:
This leftmost column is headed by the letter R, and is an absolute value. The value is not only given by the column height, using the leftmost scale (Rate scale), but is also shown as a number at the bottom of the column. The value is the number of direct I/Os per second for the disk.
This rightmost column is headed by the letter R, and is an absolute value. The value is not only given by the column height, using the rightmost scale (Msec scale), but is also shown as a number at the bottom of the column. The value is the response time of the disk in milliseconds. This is the average time to process one I/O including both queuing time and service time.
Note that the bottom value in this column is the average number of I/O packets in the disk queue. If the value of the Rate or Response time exceeds 100, asterisks are shown at the top of the column, but the value is still given at the bottom of the column. If the actual value should exceed three digits, then asterisks are shown in place of the value.
|
Copyright © 2008 CA.
All rights reserved.
|
|