

Performance Manager provides a Process display when you press KP7 from the single-node display when the Process Statistics section is selected or when you enter any of the following commands to the PSRT> prompt:
The following illustration is an example of a user name Process display:
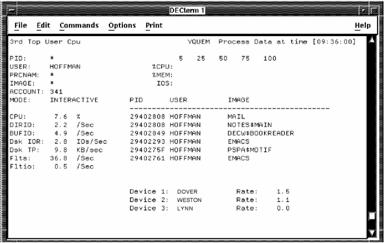
In the upper left corner is a line describing the current summarization and sort position of the Process information. This text follows the format "nth TOP key metric", where you select the key by pressing KP6 (either User, Image, Processname, Accountname, or PID), and metric is selected by KP9 (see the previous section for a list of available metrics). To proceed to the nth + 1 entry, press KP1, or KP4 to go back. To lock the display on a specific process, enter PID nnnnnnnn for the desired PID.
Also in the upper left corner is the process identification section: user name, image name, process name, account name PID, and process mode for the currently displayed process. If any of these fields have an asterisk (*), more than one process has been summarized for this screen, and the given field had more than one value.
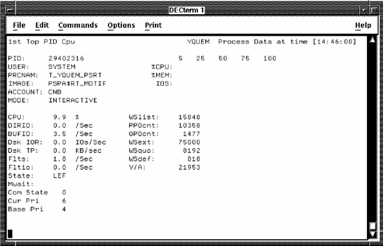
The following screen is an example of the Performance Manager Real-time Process Display, Single Process:
In the upper right corner is the name of the node and the current time of the data being viewed. Next, on the right side, are three bar charts that show CPU utilization, memory utilization and the processes working set as a percentage of the total system's memory, and the number of disk I/Os as a rate per second.
The mid-section of the screen contains the process statistics for the selected process, as in the previous illustration. If more than one process matches the selection criteria (such as a given user name), the working set data and state information is replaced by a list of processes that match the criteria, as in an earlier illustration (Performance Manager Real-time Process Display, Multiple Processes).
You can scroll through the process instances, as appear in the previous illustration, by using NextScreen and PrevScreen keys. If there is a particular PID, user name or image name that you want to lock the display on, enter the USERNAME, IMAGENAME, or PID command to do so.
For example:
PSRT> USER HOFFMAN
The last section of the display is the “volumes” section (also appearing in the earlier illustration showing Performance Manager Real-time Process Display, Multiple Processes), where disk volumes and I/O rates appear. These represent the top disks that the processes use and are list up to the top five disk volumes recorded by the main collector. By pressing KP3, you can view the top files being used by the processes. The top volumes and files data is available only when the /MODE=DISKFILE command and the default collection definition is used (/COLLECTION=CPD).
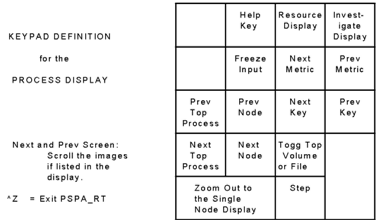
Press PF2 to view the keypad for Process displays. The following illustration shows the functions of the Process display keypad:
|
Copyright © 2008 CA.
All rights reserved.
|
|