

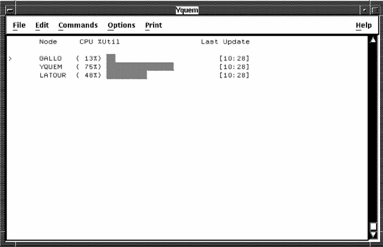
A bar-graph style screen appears when you start Performance Manager character-cell displays. By default, the percentage of CPU utilization for each node in the cluster is displayed.
If you are collecting data at two-minute intervals, factory rule IDs or user rule IDs, or both, may also appear after the time stamp. For shorter intervals, the user rules may appear.
See the RULES command and the /RULES qualifier for more information.
You can display in the following metrics previous screen:
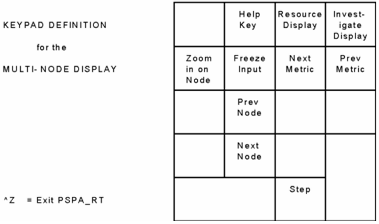
Use the multi-node keypad to perform the following tasks:
The following illustration shows the functions of the multi-node display keypad:
|
Copyright © 2008 CA.
All rights reserved.
|
|