

To specify the node for which data is to be displayed:
Performance Manager displays the Node and Metric Instance Name dialog, as shown in the following screen:
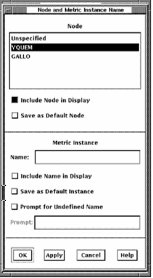
The Node and Metric Instance Name dialog lets you perform the following actions:
This would have been specified by you as a default, or at connect time, or when the panel was launched. If the panel was launched, the node passed in the launch overrides the default.
This would have been specified by you as a default, by a prompt dialog at connect time, or when the panel was launched. If the panel was launched, the metric instance name passed in the launch overrides the default.
You can also change the metric instance name by entering a new name in the Metric Instance text entry box. The metric name is interpreted as all uppercase unless you contain the name within double quotes.
For example, if the instruments in a panel are set up to look at metrics for a specific user, a user name is required to specify the metric fully. In this case, the prompt might be: “Enter User Name:”. If prompting is selected, then a prompt dialog appears at connect time requesting a user name.
Panels requiring specific metric instance names (such as user name or process name), must be provided with a prompt for the appropriate name. This lets the panel to be invoked from the panel manager and to display without errors. An example is the User_CPU panel (labeled User=SAPIRO) described in the Launching Panels section.
Note: Any changes to the node selection or the metric instance name will have no affect on the instruments until the panel is connected or reconnected.
|
Copyright © 2008 CA.
All rights reserved.
|
|