

When graphing process metrics by user you must specify either of the following user names and process metrics:
or
Performance Manager graphs include the metrics for all users that match any one of the user names you specify in the list. The resulting graph depicts each of the specified users or metrics separately on the plot.
To graph process metrics by user in DCL mode, issue the command:
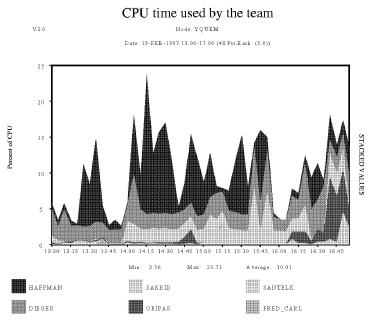
$ ADVISE PERFORMANCE GRAPH -
_$ /TYPE=CUSTOM=(USER_METRICS=CPUTIME,-
_$ SELECTION=(DIEGER,HAFFMAN,ORIPAS,-
_$ SANTELK,FRED_CARL,SARBID),-
_$ TITLE="CPU time used by the team"
The Prompting for Process Custom Graph example shows Performance Manager prompts and user input that generate the same graph using command mode and specifying the following command:
PSPA> GRAPH/TYPE=PROMPT/FORMAT=POSTSCRIPT=CHARACTERISTIC=PATTERN -
_PSPA> /OUT=CH4CUSTOM_USER_PROMPT.PS
The graph itself appears in the figure, Custom Graph for Process Usage.
The following statements are keyed to the Prompting for Process Custom Graph example:
Please select either 1) a predefined graph or
 2) a custom graph

Choice [1]: 2
0. Composite
1. YQUEM
2. GALLO

Please select a node number [0]: 1

For the CUSTOM Graph, select one of the following:

1. System Metrics
2. Process metrics selected by user name
3. Process metrics selected by image name
4. Process metrics selected by workload name
5. Disk device metrics selected by device name
6. Disk device metrics selected by volume name
7. Processor mode metrics by physical processor ID
8. HSC metrics by HSC node name
9. SCS metrics by SCS Cluster node name
10. RULE metrics by rule id
11. HSC Channel metrics by channel name
12. File metrics by file name
13. IOs by Username and Volumename
14. IOs by Imagename and VolumenameEnter Choice (1 - 14): 2

Enter Choice b(1 - 14) : 2 [1]

Select up to 6 User Names (<CR> for list): SANTELK,HAFFMAN,SARBID,ORIPAS,FRED_CARL,DIEGER [2]

Select one process metric (<CR>) for list: [3]

GRAPH
 /TYPE
 CUSTOM
 Process_metrics

The following process metrics can be requested on a custom graph.

BUFIO CPUTIME DIRIO DSKIO
DSKTP FAULTS HARDFAULTS IMAGE_ACTIVATIONS
IO_SIZE RESIDENCE RESPONSE_TIME TAPIO
TAPTP TERM_INPUT TERM_THRUPUT WSSIZE VASIZE

Select one process metric (<CR> for list): CPUTIME [4]
Enter an optional title for the CUSTOM graph <40 characters max>

Title [PSPA CUSTOM GRAPH]:CPU time used by the team [5]

PSPA>
|
Copyright © 2008 CA.
All rights reserved.
|
|