

The following command generates a custom graph:
$ ADVISE PERFORMANCE GRAPH/TYPE=CUSTOM=( -
_$ SYSTEM_METRICS=(DZRO,GVALID),TITLE="Pagefaulting")
The following example, Prompting for System Metrics Custom Graph, shows Performance Manager prompts and user input that generate the same graph in command mode:
$ ADVISE PERFORMANCE
PSPA> SELECT/BEGINNING=19-FEB-2006:13:00 -
_PSPA> /ENDING=19-FEB-2006:17:00 GRAPH=BY_NODE
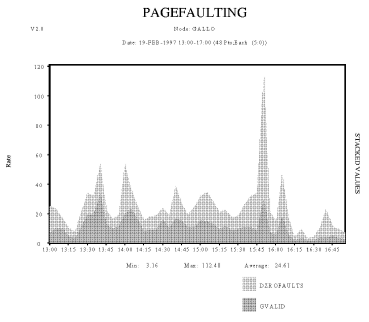
The resulting graph appears in the example, Custom Graph for System Metrics.
Processing Options
----------------------------------------------------------------
ANALYSIS REPORT NO
PERFORMANCE_EVALUATION REPORT NO
GRAPHS YES
User Names YES
Image Names YES
Hot File Names NO
User/Image Volume IO NO
IO Devices & workloads YES
By Node details YES

Reading data for node YQUEM
Reading data for node GALLO
PSPA>GRAPH/TYPE=PROMPT/FORMAT=POSTSCRIPT=CHARACTERISTIC=PATTERN/OUT=CH4CUSTOM_PROMT.PS
Please select either 1) a predefined graph or
 2) a custom graph
Choice [1]: 2
0. Composite
1. YQUEM
2. GALLO

Please select a node number [0]: 2
For the CUSTOM Graph, select one of the following:

 1. System Metrics
 2. Process metrics selected by user name
 3. Process metrics selected by image name
 4. Process metrics selected by workload name
 5. Disk device metrics selected by device name
 6. Disk device metrics selected by volume name
 7. Processor mode metrics by physical processor ID
 8. HSC metrics by HSC node name
 9. SCS metrics by SCS Cluster node name
10. RULE metrics by rule id
11. HSC Channel metrics by channel name
12. File metrics by file name
13. IOs by Username and Volumename
14. IOs by Imagename and Volumename

Enter Choice (1 - 14): 1 [1]
Select Up to 6 System Metrics (<CR> for list): [2]
GRAPH
 /TYPE
 CUSTOM
 System_metrics

Select up to 6 of the following system metrics to be displayed on a custom graph:

Sampled %CPU mode metrics (for all CPUs in an SMP configuration):

COMPAT EXEC FILE_SYS IDLE INTERRUPT
KERNEL MP_SYNCH SUPER USER_MODE

Sampled process counts by process state:

COLPG MWAIT CEF PFW CUR
LEF LEFO HIB HIBO SUSP
SUSPO FPG COM COMO
INPROCACT INPROCINACT
OUTPROCACT OUTPROCINACT
TOTAL_PROCESSES

Sampled process counts by type:

BATCH_PROCESSES INTERACTIVE_PROCESSES
NETWORK_PROCESSES DETACHED_PROCESSES

Derived CPU time metrics:

%CPU Utilization Compute Queue
------------------------------------- -----------------------------
CPU_BATCH CPU_INTERACTIVE BATCH_COMQ INT_COMQ
CPU_NETWORK CPU_OTHER NETWORK_COMQ DETACHED_COMQ
CPU_DETACHED CPU_TOTAL
CPU_MP_INT

Sampled paging/swapping/memory metrics:
Paging Rates MemoryPages Swaprate
--------------------------------- -------- --------
DZROFAULTS FAULTS FREEFAULTS FREECNT INSWAP
GVALID MFYFAULTS PREADIO MPYCNT
PREADS PWRITES PWRITIO
SYSFAULTS WRTINPROG IMAGE_ACTIVATIONS

Derived paging/swapping/memory metrics:

Memory Utilization as a percentage Pagefile Utilization
---------------------------------- --------------------
FREELIM FREELIST MODIFIED PAGEFILE_UTILIZATION
MEM_TOTAL SYSTEMWS USERWS
VMSALLOC

Sampled system IO rates:

BUFIO DIRIO ERASE_QIO FILE_CACHE_HIT
FILE_CACHE_MISS FILE_OPEN LOGNAM MBREADS MBWRITES
SPLITIO WINDOW_TURN

Derived system IO rates:

 Disks Terminals and Printers
----------------------------- ---------------------------------
DISK_PAGING DISK_SWAPPING LAT_TERMIO NV_TERMIO RT_TERMIO
DISK_USER TT_TERMIO TX_TERMIO TW_TERMIO
 WT_TERMIO OTHERBUFIO
Sampled DECnet metrics:

ARRLOCPK ARRTRAPK DEPLOCPK RCVBUFFL TRCNGLOS

Sampled distributed locking metrics:

DEADLOCK_FIND DEADLOCK_SEARCH INCOMING_LOCKING
LOCAL_LOCKING OUTGOING_LOCKING

Sampled pool metrics:

IRP_CNT IRP_MAX LOCK_CNT LRP_CNT
LRP_MAX NP_FREE_BLOCKS NP_FREE_BYTES NP_FREE_LEQ_32
NP_MAX_BLOCK NP_MIN_BLOCK NP_POOL_MAX PG_FREE_BLOCKS
PG_FREE_BYTES PG_FREE_LEQ_32 PG_MAX_BLOCK PG_MIN_BLOCK
PG_POOL_MAX RESOURCE_CNT SRP_CNT SRP_MAX

Other system metrics:

SM_RESPONSE MED_RESPONSE LG_RESPONSE
CPU_VUP_RATING RELATIVE_CPU_POWER

Select Up to 6 System Metrics (<CR> for list): DZROFAULTS, GVALID [3]
Enter an optional title for the CUSTOM graph <40 characters max>

Title [PSPA CUSTOM GRAPH]:PAGEFAULTING [4]
The following statements are keyed to the Prompting for System Metrics Graph:
|
Copyright © 2008 CA.
All rights reserved.
|
|