

For ReGIS and PostScript graphs, the X_POINTS keyword indicates the number of data points to plot along the x-axis of the graph, and is specified with the /FORMAT=REGIS=X_POINTS=number qualifier, from a DCL command, or /X_POINTS=number qualifier from command mode.
For Tabular graphs, the X_POINTS keyword specifies the number of data points to present in the report, and is specified with the /FORMAT=TABULAR=X_POINTS=number qualifier. The valid range for X_POINTS is 2 to 480, the default is generally from 45 to 90, but is computed to produce an even time interval per point.
The following are examples of specifying the X_POINTS keyword:
$ ADVISE PERFORMANCE GRAPH/FORMAT=REGIS=X_POINTS=number
PSPA> SELECT GRAPH/X_POINTS=number
Specify the Additional Options... option from the
Select Data dialog box.
As the value of X_POINTS increases, more peaks and valleys appear on a graph. As the value decreases, the peaks and valleys are smoother because Performance Manager averages data points within the time frame requested.
The next three figures illustrate the relationship between the value of X_POINTS and a time frame of 4 hours. During this period the Performance Manager records statistics 120 times (every 2 minutes).
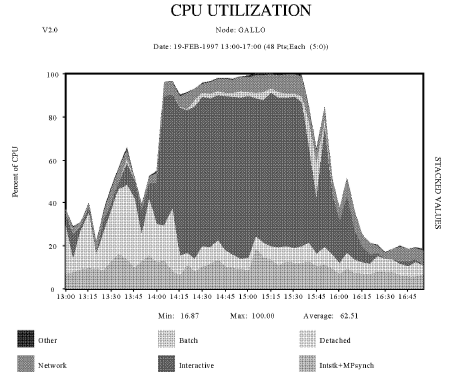
The following graph, X_POINTS Default Value Graph, uses 60 for the value of X_POINT. Therefore, two data records are averaged to calculate the value of each point plotted.
This command generates the graph:
$ ADVISE PERFORMANCE GRAPH/BEGINNING=19-FEB-2006:13:00/ENDING=19-FEB-2006:17:00 -
_$ /TYPE=CPU_UTILIZATION/NODE=GALLO/OUTPUT=SUPPLY_XP_60.PS -
_$ /FORMAT=POST=CHARACTERISTIC=PATTERN
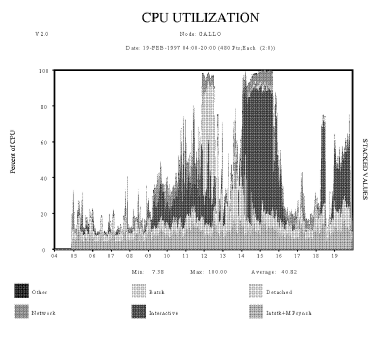
In the Maximum X_POINTS Graph, the value of X_POINTS is 480. Therefore, the graphing facility did not average the data.
This following command generates the following graph:
$ ADVISE PERFORMANCE GRAPH/BEGINNING=19-FEB-2006:04:00/ENDING=19-FEB-2006:20:00 -
_$ /TYPE=CPU_UTILIZATION/NODE=GALLO/OUTPUT=CH4CPU_XP_480.PS -
_$ /FORMAT=POSTSCRIPT=(CHARACTERISTIC=PATTERN,X_POINTS=480)
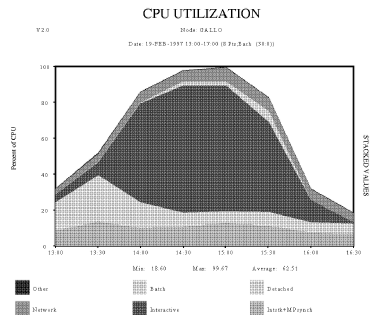
In the Minimum X_POINTS Graph, the value of X_POINTS is 8. The graphing facility averages every 15 data points in the four hour time span.
This command generates the graph:
$ ADVISE PERFORMANCE GRAPH/BEGINNING=19-FEB-2006:13:00/ENDING=19-FEB-2006:17:00 -
_$/TYPE=CPU_UTILIZATION/NODE=GALLO/OUTPUT=CH4CPU_XP_8.PS -
_$ /FORMAT=POSTSCRIPT=(CHARACTERISTIC=PATTERN,X_POINTS=8)
|
Copyright © 2008 CA.
All rights reserved.
|
|