

Clicking on the Ranges and Thresholds menu item, Performance Manager displays the Ranges and Thresholds dialog for the selected instrument.
Depending on your selected instrument, Performance Manager displays one of the following dialoges:
The following example shows the Bar Graph Range and Thresholds screen:
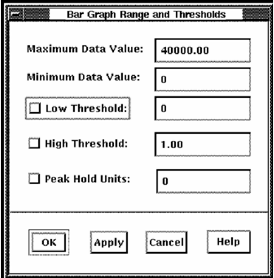
The Bar Graph Range and Thresholds dialog lets you do the following actions:
You can enter any of the following values:
Specifies the maximum value of the graph's scale. The default value is 100.
Specifies the minimum value of the graph's scale. The default value is 0.
Enables and specifies a value line to be displayed on the graph. Data below this line is displayed in the patterns and colors you set for low threshold.
Enables and specifies a value line to be displayed on the graph. Data above this line is displayed in the patterns and colors you set for high threshold.
Enables peak hold and specifies the number of units of time the peak (maximum value attained by the metric) is held in the display. This peak value indicator is displayed in the patterns and colors you set for the peak hold.
|
Copyright © 2008 CA.
All rights reserved.
|
|