

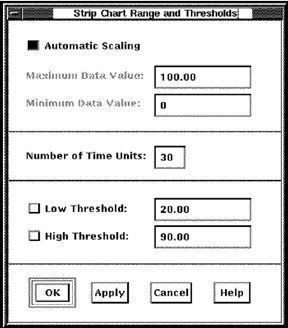
The Strip Chart Range and Thresholds dialog lets you do the following actions:
You can enter any of the following values:
Specifies that the height of the chart is to be dynamically adjusted to match the largest data value shown.
Specifies the maximum value of the chart's scale. The default value is 100.
Specifies the minimum value of the chart's scale. The default value is 0.
Specifies the number of time intervals to display in the chart. For example, if the data collection time interval is 10 seconds and the number of time interval units is set at 30, then up to 300 seconds, or 5 minutes of data is displayed.
Enables and specifies a value line to be displayed on the chart. Data below this line appears in the patterns and colors you set for low threshold.
Enables and specifies a value line to be displayed on the chart. Data above this line appears in the patterns and colors you set for high threshold.
|
Copyright © 2008 CA.
All rights reserved.
|
|