

Choose the Specific Data . . . menu item from the Select menu to specify data to be included in a dump report. The DECwindows Motif interface displays the Data Selection dialog box.
The following example shows the Data Selection window:
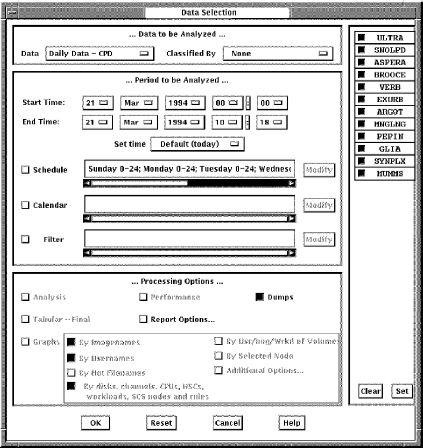
The Data Selection dialog box allows you to do the following actions:
You can enter any of the following parameters in this dialog box:
Data to be Analyzed, Data—Specifies the source of data to be analyzed. Press MB1 on the Data selection box and an option menu appears. The menu lists history file descriptors and daily data. Release on the item you want. The option menu disappears. The menu item you chose is now the current data source. The default data source is daily data.
Note: Changing the source of data can change how it is classified. If you choose a history file descriptor, the Classify By options are changed to reflect those specified by the descriptor's definition.
If you choose daily data, Classify By options is ignored for viewing dump reports. For this reason the source of the data should always be chosen ahead of the classification of the data.
This option is relevant to displaying history file data that is based on specific workload families. Specifies how the Performance Agent is to classify data in the dump report. Press MB1 on the Classify By selection box and an option menu appears. The menu lists workload families. Release on the family name you want. The default option is None.
Hold MB1 down on any of the date and time fields to see all available choices. Release MB1 on the desired value. Press and hold MB2 to advance through the possible values. Press and hold MB3 to move back through the values.
Press MB1 on the Set time option button and an option menu appears.
You can enter any of the following parameters:
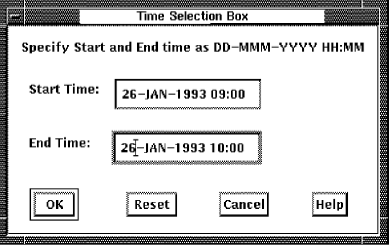
The day and time can be typed in accordance to the format shown in the window.
Clicking the OK button applies the start and end times and removes the dialog box from the screen. The Reset button restores the start and end times to those displayed in the Data Selection box.
Clicking the Cancel button removes the dialog box without changing the time fields currently displayed in the Data Selection box.
Schedule—Use the Schedule Selection dialog box to modify the current selection schedule. This schedule is applied at data selection time to select specific hours of the week for analysis. Click the Schedule button and then click Modify to access the Schedule selection box, as shown in the following example:
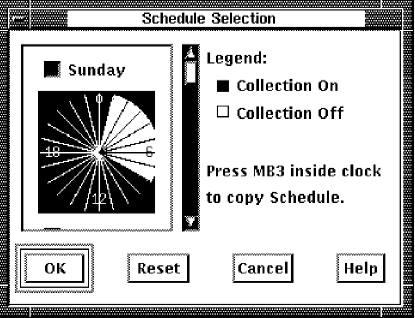
You can also select time periods by pressing MB1 and dragging the pointer through the hours on
To copy a schedule from one day to another
The Schedule Selection box is removed and the new schedule is displayed.
You can specify a monthly schedule for selecting data for analysis. To access the Dates File Selection box, click the Calendar button and then the Modify button. To enter the file of date ranges, click the Load Date ranges box and enter the file, as shown in the following example:
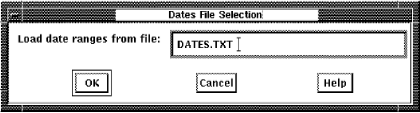
For example, if you wanted to view dump reports for all the Mondays in January but wanted to substitute a Tuesday in place of a Monday that was a holiday, you could do this using a dates file with the following format:
04-JAN-2008 10:00, 04-JAN-2008 10:08
11-JAN-2008 10:00, 11-JAN-2008 10:08
19-JAN-2008 10:00, 19-JAN-2008 10:08
25-JAN-2008 10:00, 25-JAN-2008 10:08
Using the preceding list, dump reports are created for the times specified for the four days listed, three Mondays and Tuesday the 19th.
After entering the file, click OK. The box is removed and the Start Time and End Time displays are updated and cannot be changed.
When you no longer wish to use the dates file, click the Calendar button. The Start Time and End Time buttons are reactivated.
This option is available with the Performance Manager. See the Performance Manager Administrator Guide for information about using a filter to select a subset of data for reporting and graphing.
Although many options are available (Analysis, Performance, and Graphs), with Performance Agent only the Dumps option is allowed. Dump specifies that the unanalyzed data are made available for your inspection.
For more information about other types of reports, see the CA Performance Management for OpenVMS Performance Manager Administrator Guide.
By default, reporting for all nodes in a collection definition is enabled. Click a node's toggle button to include or exclude the node from the Performance Agent processing. Clear and Set buttons are available for adjusting all toggles.
The OK button applies your selection, removes the data selection box and activates a Work in Progress dialog box, which includes a real time display of the progress of the analysis procedure. In the case of a Dumps-only selection, no preprocessing of the data is done. The Work in Process immediately shows the procedure as 100% complete.
The Cancel button closes the Data Selection dialog box and resets all widgets.
The Reset button sets all widgets back to their settings of either the startup defaults, or the last OK'd selection.
|
Copyright © 2008 CA.
All rights reserved.
|
|