

Managers (such as the Operations Center Manager) and engineers (such as an IT Operator or IT Architect), need continuous information about the health of their systems. They work with the Tool Administrator to configure Data Aggregator to generate events for devices that deviate from normal performance expectations. These events help them proactively monitor the health of their network and take remedial steps to correct a performance issue, as needed.
For example, your organization recently virtualized several business critical applications to improve efficiency. The IT Architect and the Operations Center Manager want to monitor these virtual servers to be sure they can handle the load from these applications. The Tool Administrator creates a monitoring profile and adds event rules to find over-utilized CPUs and virtual memory issues for the collection of virtual devices. Data Aggregator automatically evaluates all of the devices in the collection after every poll for each device. If needed, Data Aggregator raises or clears events when the devices satisfy event rule conditions.
The following illustration shows how to generate events automatically to help you monitor device performance issues:
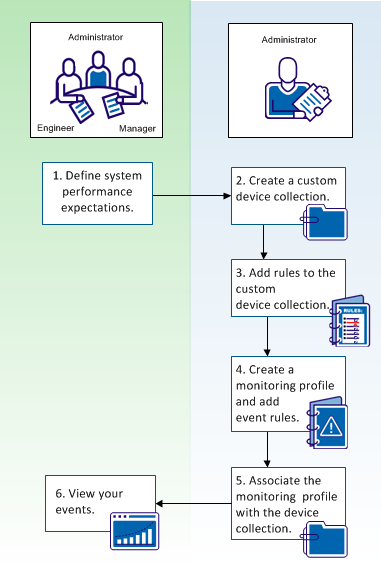
As shown, the Tool Administrator works with engineers and managers to define performance expectations for a set of devices. After this discussion, the administrator decides to create a custom device collection, create a monitoring profile, and assign event rules to the monitoring profile. To begin monitoring devices, the administrator associates the monitoring profile, with its assigned event rules, to the custom device collection. As CA Performance Center generates events, the administrator, engineers, and managers can view the events in CA Performance Center.
|
Procedures |
|---|
|
Assign the monitoring profile to a custom device collection. |
|
Copyright © 2015 CA Technologies.
All rights reserved.
|
|