

The Top Protocols (Bar) views show the top high-volume IP protocols for traffic on a particular interface. A bar chart shows which protocols account for the most traffic on the selected interface.
This view gives you an overall picture of how much data is associated with particular protocols--and, therefore, with applications--on the interface. The view also lets you determine whether the application protocols are related to business-critical processes, or are related to low-priority or non-business related processes such as unauthorized web use.
You can view protocol traffic for incoming flows, outgoing flows, or all flows--as shown in the example graphic of a view in the CA Performance Center Console.
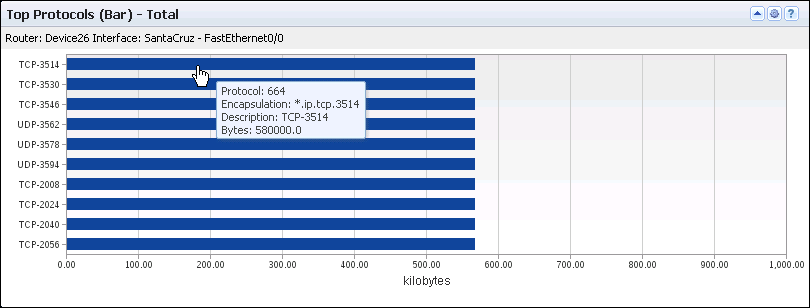
The bar chart includes the following information for a maximum of 10 protocols:
Identifies the interface that is used for the report. The identifier string consists of the router name, interface name, and interface description (under the view title).
(NPC) The identifier line also includes the interface speed.
Identifies the protocol by its descriptor (Y-Axis).
Measures the total amount of protocol data expressed in a scale that is appropriate for the highest-volume protocol (X-Axis).
Performance Center views show the data from the time range that is defined for the page.
Opening the View
To see this view in the Performance Center Console, go to one of the following locations:
Available Actions
You can perform several actions in this view, including the following ones:
Find the Comparable View in the NFA Console
The Top Protocols bar charts in the Performance Center Console are similar to the Top Protocol view on the Enterprise Overview page in the NFA console.
|
Copyright © 2015 CA Technologies.
All rights reserved.
|
|