

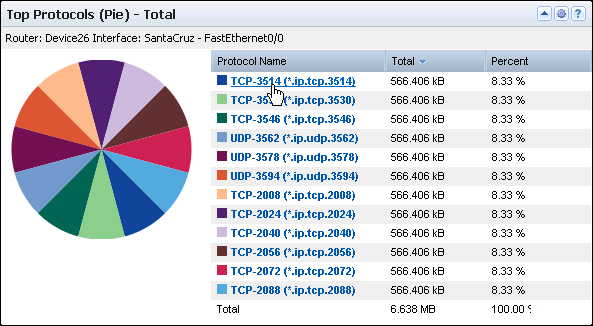
The Top Protocols (Pie) views show the protocols that are associated with the highest traffic volumes on the selected interface. The example graphic shows the view in the CA Performance Center Console.
The table includes the following information by default:
Identifies the interface that is used for the report. The identifier string consists of the router name, interface name, and interface description (under the view title).
(NPC) The identifier line also includes the interface speed.
Identifies the protocol by its keyword and TCP/UDP port assignment.
Records the total volume of network traffic on the interface that is associated with the protocol
(CA PC) Records how much the protocol consumes out of the total traffic that is displayed.
Performance Center views show the data from the time range that is defined for the page.
Opening the Views
To see these views in the Performance Center Console, go to one of the following locations:
Available Actions
You can perform several actions in this view, including the following ones:
Find Protocol Pie Charts in the NFA Console
You can display pie charts with protocol traffic volumes in the NFA console for a selected interface:
View: Protocol Summary (In and Out) for the Top N Protocols, plus other overview views.
View: Protocol Summary (In, Out, and Total) for the Top N Protocols.
Views: Protocol Hosts Summary (From and To) for the single protocol; Protocol Conversations Summary (Total) for the single protocol.
To display Flow Forensics-level detail, click the Flow Forensics link and run a Flow Forensics report.
|
Copyright © 2015 CA Technologies.
All rights reserved.
|
|