

The Stacked Protocol Trend views in CA Performance Center show the top protocols that are used the most heavily for traffic on the selected interface. The views also show when the traffic occurred.
The example graphic shows a Stacked Protocol Trend view that shows a timeline of rates for each listed ToS value. You can configure the view to display rate, utilization, or volume information.
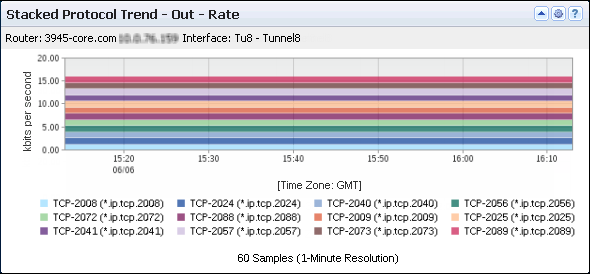
The view includes the following information:
Consists of the router name, interface name, and interface description (under the view title). The interface description consists of the ifDescr value by default, so it may be slightly different than the interface description that is shown in CA Network Flow Analysis.
Show the data rate, data volume, or interface capacity utilization for each Top N Protocol that is associated with traffic on the interface.
Point in time during data transmission--expressed in hours and minutes (X-Axis).
Depending on the data direction, the data is inbound to the interface, outbound from the interface, or both.
Identifies the protocol for each color band by protocol keyword and tcp/udp port (bottom of the view).
By default, views and reports show the most recent 24 hours of data.
To see the Stacked Protocol Trend views in CA Performance Center, go to one of the following locations:
Available Actions for This View
You can perform several actions in this view, including the following actions:
Find Protocol Trend Data in NFA Console Views and Reports
You can display protocol volume in the NFA console in trend charts or stacked trend charts for a selected interface:
Views: Stacked Protocol Trend (In and Out) for the Top N Protocols, plus other overview views.
Views: Stacked Trend for the Top N Protocols (In, Out, and Total).
Views: Trend (In, Out, and Total) for each of the Top N Protocols.
Views: (Depending on the selected report subtype): trends, stacked trends, trend summaries, and multi-trend summaries for protocols, protocol hosts, and protocols in conversations.
To display Flow Forensics-level detail, click the Flow Forensics link and run a Flow Forensics report.
|
Copyright © 2013 CA.
All rights reserved.
|
|