

The Top Protocols (Pie) views show the protocols that are associated with the highest volumes of network traffic on the selected interface. You can use this information for quick comparisons of the amounts of inbound and outbound data for particular applications on the interface, for example.
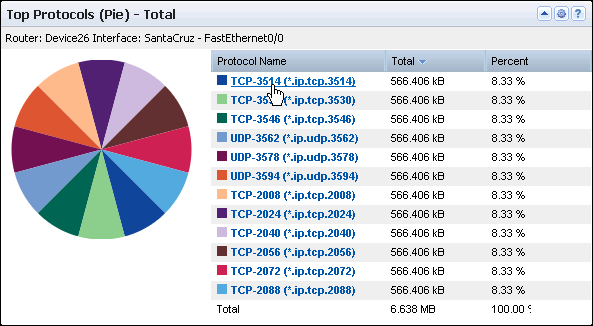
An identifier near the top names the router and interface whose data is displayed. The table includes the following information by default:
Identifies the protocol by its keyword and TCP/UDP port assignment.
Records the total volume of network traffic on the interface that is associated with the protocol
Records the percentage of the total network traffic for the displayed protocols that is associated with the particular protocol.
By default, views and reports show the most recent 24 hours of data.
To see a Top Protocols (Pie) view in CA Performance Center, add it to a custom dashboard.
Available Actions for This View
You can perform several actions in this view, including the following actions:
Find Protocol Pie Charts in the NFA Console
You can display pie charts with protocol traffic volumes in the NFA console for a selected interface:
View: Protocol Summary (In and Out) for the Top N Protocols, plus other overview views.
View: Protocol Summary (In, Out, and Total) for the Top N Protocols.
Views: Protocol Hosts Summary (From and To) for the single protocol; Protocol Conversations Summary (Total) for the single protocol.
To display Flow Forensics-level detail, click the Flow Forensics link and run a Flow Forensics report.
|
Copyright © 2013 CA.
All rights reserved.
|
|