")

|
|
|
The Top Flows by Interface views in CA Performance Center are graphical summaries of high-flow interfaces across the enterprise.
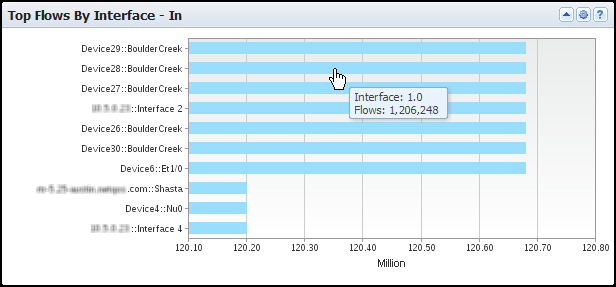
The view includes the following information for up to 10 top interfaces that transmitted flows during the reporting period:
Identifies the interface by its device name/interface name (Y-Axis).
Measures the number of flows that the interface transmitted (for example, in millions of flows) (X-Axis).
By default, views and reports show the most recent 24 hours of data.
To see the Top Flows by Interface views in CA Performance Center, go to one of the following locations:
Available Actions for This View
You can perform several actions in this view, including the ones in the following list:
Find Flow Count Data in NFA Console Views and Reports
To see the flow count for high-volume interfaces in the NFA console, drill into the Flows view for an interface or run a Flow Forensics report:
The Interfaces page opens and shows the Flows view for the selected interface. The trend charts include lines that indicate the number of inbound and outbound flows.
The Flow Forensic table opens and shows interface flow counts and extensive information about each flow.
| Copyright © 2012 CA. All rights reserved. |
|