
")
|
|
|
The Top Protocols (Bar) views show the top 10 highest-volume IP protocols for traffic on a particular interface. A bar chart shows which protocols account for the most traffic on the selected interface.
This view gives you an overall picture of how much data is associated with particular protocols--and, therefore, with applications--on the interface. The view also lets you determine whether the application protocols are related to business-critical processes, or are related to low-priority or non-business related processes such as unauthorized web use.
You can view protocol traffic for incoming flows, outgoing flows, or all flows--as shown in the example graphic.
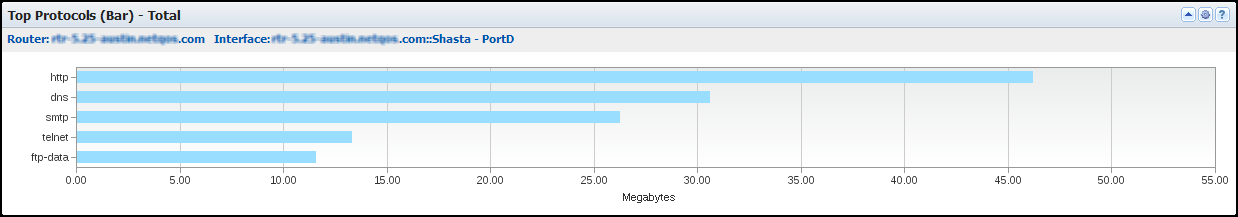
The view includes a bar for each high-volume protocol on the selected interface. A text string near the top of the view identifies the interface whose data is displayed. The bar chart includes the following information:
Identifies the protocol by its keyword (Y-Axis).
Measures the total amount of data that was associated with the protocol (for example, in number of megabytes) (X-Axis).
By default, views and reports show the most recent 24 hours of data.
To see a Top Protocols (Bar) view in CA Performance Center, add it to a custom dashboard.
Available Actions for This View
You can perform several actions in this view, including the ones in the following list:
Find the Comparable View in the NFA Console
The Top Protocols (Bar) views in CA Performance Center are similar to the Top Protocol view on the Enterprise Overview page in CA Network Flow Analysis.
| Copyright © 2012 CA. All rights reserved. |
|