

|
|
|
The Stacked ToS Trend views show the interface traffic for the top ToS, including the time the traffic occurred.
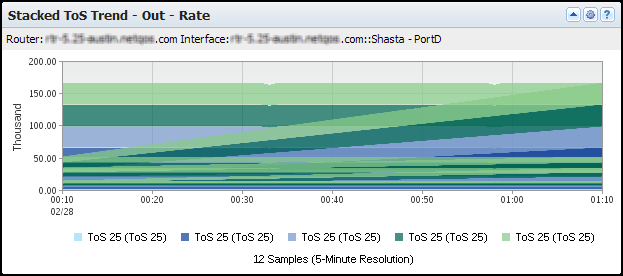
The view shows a timeline of the data rate, interface capacity utilization, or data volume for the top ToS values in use during the reporting period--up to a maximum of ten ToS. The view includes the following information:
Consists of the router name, interface name, and interface description (under the view title).
Show the data rate, data volume, or interface capacity utilization for each Top N ToS that is associated with traffic on the interface.
Point in time during data transmission--expressed in hours and minutes (X-Axis).
Data volume at each point in time--for example, expressed in thousands of flows in a Rate view or kilobytes in a Bytes view (Y-Axis). Depending on the data direction, the data volume is inbound to the interface, outbound from the interface, or both inbound and outbound. Rate is calculated by dividing the number of flows by the elapsed transmission time.
Percentage of the total interface capacity that the ToS uses (Y-Axis). The utilization percentage is calculated by dividing the data rate by the data speed, as measured on inbound traffic, outbound traffic, or all traffic.
Identifies the ToS for each color band by ToS number and label (bottom of the view).
By default, views and reports show the most recent 24 hours of data.
To see the Stacked ToS Trend views in CA Performance Center, go to one of the following locations:
Available Actions for This View
You can perform several actions in this view, including the ones in the following list:
Find ToS Trend Data in NFA Console Views and Reports
You can display ToS volume in trend charts or stacked trend charts in the NFA console for any interface you have selected:
Views: Stacked ToS Trend (In and Out) for the Top N ToS, plus other overview views.
Views: Stacked Trend for the Top N ToS (In, Out, and Total).
Views: Trend (In, Out, and Total) for each of the Top N ToS.
Views: Trend (In and Out with baselines), Stacked ToS Trend (In and Out).
Views: Stacked ToS Trend (In and Out).
Views: Conversation Trend (maximum of 7 views for different timespans).
To display Flow Forensics-level detail, click the Flow Forensics link and run a Flow Forensics report.
| Copyright © 2012 CA. All rights reserved. |
|