

|
|
|
You can look more closely at the data points from a small range by using the zoom feature. The ability to "zoom in" on a time frame is available for views that contain trend (line) charts. The feature is not available for bar charts, tables, or gauges.
Follow these steps:
Note: You cannot zoom in on a bar chart, table, or gauge.
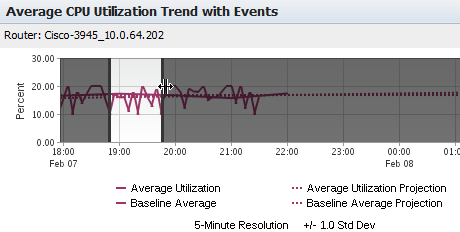
Select an area that spans at least 30 minutes. Black lines appear to indicate a valid selection.
When you release the mouse button, the custom time period you selected is applied to the current view.
The view is refreshed. The previous time period is now applied to the view.
The dashboard page is refreshed. The new time period is now applied to all views on the current dashboard page.
| Copyright © 2012 CA. All rights reserved. |
|