

Interface Reports › Interface Report Types › Capacity Planning Report › Views on the Capacity Planning Report Page
Views on the Capacity Planning Report Page
You can configure the Capacity Planning report views to display historical data and calculate projections for three types of interface data on the selected interface:
- IP Summary - Overview of traffic
- Protocols - Protocol traffic
- ToS. - ToS
To change the data type, select a different option from the secondary menu at the top of the page.
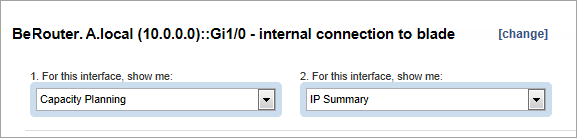
The views that are shown on the report page are determined by two sets of options:
- Secondary report mode: IP Summary (default setting), Protocols, or ToS
- Presentation mode: Rate (default setting), Volume, or Utilization
IP Summary Report Page
The IP Summary report page displays the following view and table.
- IP Summary Trend - Total - Overall traffic inbound and outbound on the selected interface
Two trend charts are included:
- Rate presentation - Rate In and Rate Out trend charts show the data rates, expressed in a scale that is appropriate for the highest-rate value in the view (Y-Axis).
- Volume presentation - Bytes In and Bytes Out trend charts show the data volume, expressed in a scale that is appropriate for the highest volume in the trend chart (Y-Axis).
- Utilization presentation - Utilization In and Utilization Out trend charts show the utilization of interface capacity, which is measured in percentages (Y-Axis).
The X-Axis shows date and time progression.
The charts show color-coded lines:
- Green line - Rate or volume of inbound data, or the utilization of inbound capacity
- Blue line - Rate or volume of outbound data, or the utilization of outbound capacity
- Red line - Threshold, which is configured by setting the Percentage value in the Trend Settings dialog (Calculations area)
The historical data has a white background; the projected data has a gray background.
- IP Summary Table
The IP Summary table contains the following columns:
- Direction: Traffic direction with respect to the interface, either inbound (In) or outbound (Out)
- Trend: Icon that shows whether the traffic is increasing or decreasing
- Daily Change: Change over a day that is calculated for the rate (bps), volume (Bytes), or utilization (%)
- Days Until Threshold: Number of days until the traffic is expected to reach the known capacity of the interface
- Date of Threshold: Calendar date on which the traffic is expected to reach the known capacity of the interface
Protocols or ToS Report Page
The Protocol and ToS report pages display stacked trend charts of the historical traffic for a maximum of 12 protocols or ToS. A stacked trendline shows the predicted future traffic for each protocol or ToS.
The report page displays the following views and tables.
- Protocol Stacked Trend or ToS Stacked Trend (In and Out versions) - Inbound and outbound protocol traffic on the selected interface
- Rate presentation - Data rates, expressed in a scale that is appropriate for the highest-rate value in the view (Y-Axis).
- Volume presentation - Data volume, expressed in a scale that is appropriate for the highest volume in the view (Y-Axis).
- Utilization presentation - Utilization of capacity for the selected interface, which is measured in percentages (Y-Axis).
The X-Axis shows date and time progression.
The red Threshold line shows the outbound threshold level, which is set in the Percentage field of the Trend Settings (Calculations) dialog.
The historical data has a white background; the projected data has a gray background.
- Protocol or ToS Table (In and Out versions)
The tables contain the following columns:
- Protocol Name: (Protocol table only) Name of the protocol, which may consist of its keyword and encapsulation (transport protocol and port number).
- Type of Service: (ToS table only) ToS label, which may be a default label or a label your administrator has configured
- Trend: Icon that shows whether the traffic is increasing or decreasing
- Growth %: Percentage of traffic increase
- Current %: Percentage of the total traffic that the protocol or ToS is using at the end date of the historical analysis (the current date)
- Projected %: Percentage of the total traffic that the protocol or ToS is using at the end date of the traffic projection
The Trend and Daily Change columns are defined in the IP Summary table description.
Copyright © 2014 CA.
All rights reserved.
|
|