

Interface Reports › Interface Report Types › Top N Autonomous System Numbers Report
Top N Autonomous System Numbers Report
The Top N AS report provides AS (Autonomous System) Next Hop data. The Next Hop data provides high-level summaries of total volume and rate statistics for each AS number on a particular interface. This type of reporting is valuable for managing network routes efficiently. The information helps service providers control costs by comparing traffic usage through transit networks versus traffic through networks with peer agreements.
This topic describes how to display a Top N AS report.
Follow these steps:
- Display an interface report in either of the following ways:
- Locate and click an interface on the Interfaces page.
- Click an interface link in an existing view--for example, on the Enterprise Overview page.
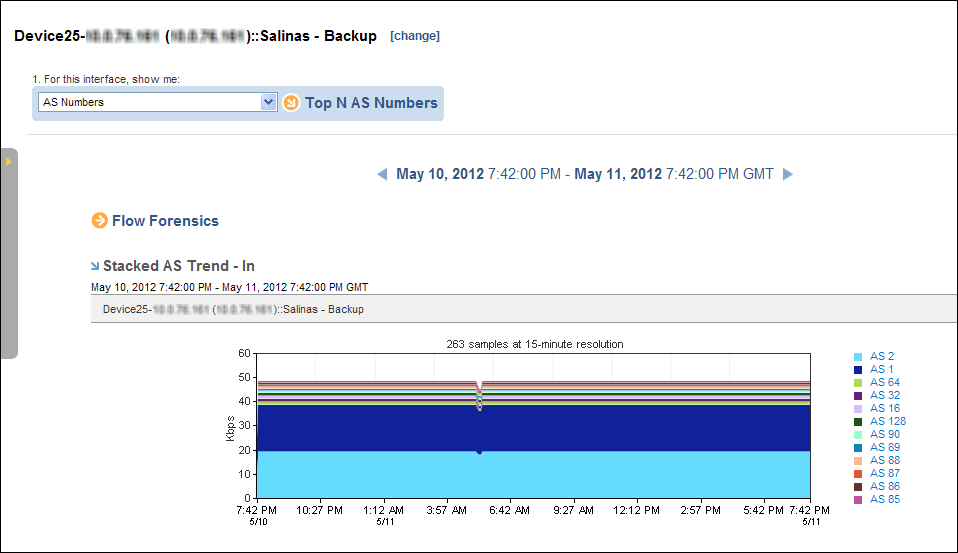
- Select AS Numbers as the report type at the top.
- Make sure the Top N AS Numbers link appears next to the report type setting.
The report page is updated.
- (Optional) Change the data presentation type and the data measurement type by using the Presentation options.
- Stacked Trend Chart (default setting) of Rate, Volume, or Utilization data
- Trend Chart of Rate, Volume, or Utilization data
- Pie Chart
- Summary Table of Rate, Volume, or Utilization data
Each option displays views of data that is inbound (In) and outbound (Out) on the interface and data that is coming from (From) the previous hop and going to (To) the next hop.
- (Optional) Change the reporting period: Open the Timeframe dialog by clicking the timeframe link.
The reporting period is the most recent 24-hour period by default.
Copyright © 2014 CA.
All rights reserved.
|
|