

Interface Reports › Interface Report Types › Top N Hosts Report
Top N Hosts Report
The Top N Hosts report provides information about the hosts that generate the most traffic on the selected interface. This topic describes how to display a Top N Hosts report.
Follow these steps:
- Display an interface report in either of the following ways:
- Locate and click an interface on the Interfaces page.
- Click an interface link in an existing view--for example, on the Enterprise Overview page.
- Select Hosts as the report type at the top of the page.
- Make sure the report scope is set to Top N Hosts. The Top N Hosts link should appear next to the report type setting.
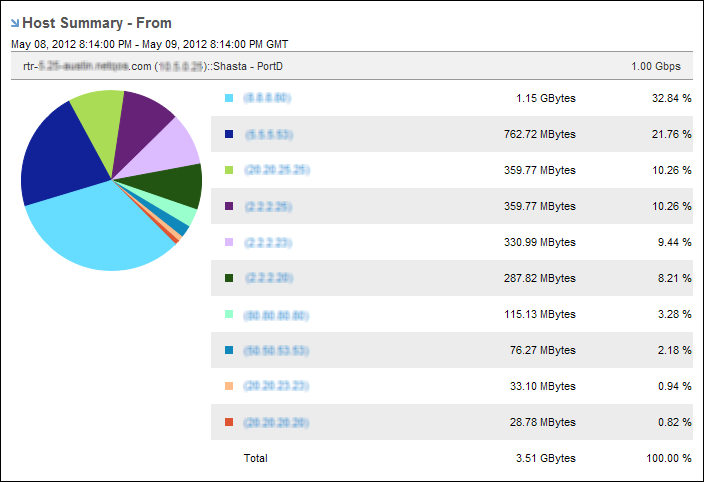
The report page is updated to show host summary pie charts by default. The report includes views for the following host data:
- From: Top hosts who sent data to the interface.
- To: Top hosts who received data from the interface.
- Total: Top hosts who either sent data to the interface or received data from the interface.
- (Optional) Change the data presentation type and the data measurement type by using the Presentation options.
- (Optional) Change the reporting period: Open the Timeframe dialog by clicking the timeframe link.
The reporting period is the most recent 24-hour period by default.
Display an Interface Report for a Single Host
To drill down to more detailed, host-specific data for the selected interface, click a host name in a Top N Host view. An overview report for the host on that interface opens. You can view the host details or the host protocols.
You can view this type of report in Details mode or Protocols mode, which have the following options:
- Details mode: Charts of rate, volume, or utilization data in any combination of the following views:
- (Displayed by Default) Last Hour, Last 2 Hours, Last 8 Hours, and Daily
- Weekly, Monthly, and Yearly
- Protocols mode Trend Chart or Summary Table: Rate, volume, or utilization for the protocols that the hosts used. You see the data coming into the interface and the data going out from the interface.
- Protocols mode Stacked Trend Chart: Data for all protocols that the hosts used (coming into and going out of the interface).
To return to the summary view, click the link that is named for the currently selected host and click Select Top N Hosts.
Find Host Views in the Performance Center Console
Host data from CA Network Flow Analysis is displayed in the following Performance Center Console locations. (The built-in dashboards and report pages that are noted here show the views by default.)
- Top Enterprise Hosts by Volume or Top Hosts (Bar)
- (CA PC) Infrastructure Overview, Network Overview, and custom dashboards
- (NPC) Enterprise, Traffic Analysis, Network Overview, and custom dashboards
- Top Hosts (Bar)
- (CA PC) Custom dashboards; Interface Pages: IP Performance report page
- (NPC) Custom dashboards; Interface Pages: Interface Capacity, Interface QoS, and custom tab views
- Top Hosts (Pie)
- (CA PC) Custom dashboards; Interface Pages: IP Performance report page
- (NPC) Custom dashboards; Interface Pages: Interface QoS, and custom tab views
- Top Hosts (Table)
- (CA PC) Custom dashboards
- (NPC) Custom dashboards; Interface Pages custom tab views
Copyright © 2014 CA.
All rights reserved.
|
|