

The Top Hosts (Bar) views show the top high-volume hosts for a particular interface. You can use this view to determine the IP addresses of hosts that are responsible for high volumes of network traffic. You can then contact the owner or user of each host to investigate the nature and purpose of the traffic.
You can view the hosts for incoming flows, outgoing flows, or all flows, as shown in the example of a view in the CA Performance Center Console.
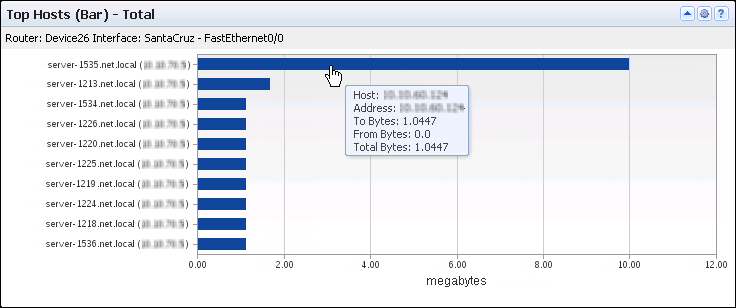
The bar chart includes the following information for a maximum of 10 hosts:
Identifies the interface that is used for the report. The identifier string consists of the router name, interface name, and interface description (under the view title).
(NPC) The identifier line also includes the interface speed.
Identifies the host server by its fully qualified DNS name (if available) and IP address (Y-Axis).
Measures the total amount of data for the host on the interface, expressed in a scale that is appropriate for the highest-volume host (X-Axis).
Performance Center views show the data from the time range that is defined for the page.
Opening the View
To see this view in the Performance Center Console, go to one of the following locations:
Available Actions
You can perform several actions in this view, including the following ones:
Find Host Trend Views in the NFA Console
The Enterprise Overview page in the NFA console displays traffic volume for the top hosts in a bar chart.
You also can display host volume in trend charts for a selected interface:
View: Hosts Multi Trend Summary (From and To) for the Top N Hosts, plus other overview views.
View: Host Trend for each of the Top N Hosts.
Note: To see trend charts for a single host, click Top N Hosts and select a host as the filter.
To display Flow Forensics-level detail, click the Flow Forensics link and run a Flow Forensics report.
|
Copyright © 2014 CA.
All rights reserved.
|
|