

The Top Hosts (Table) views show rate, volume, or utilization for the hosts who exchange the highest volume of data on a particular interface.
The example shows a Top Hosts (Table) view in the CA Performance Center Console. The view is configured to show the rate for each listed host. You can configure the view to display rate, utilization, or volume information.
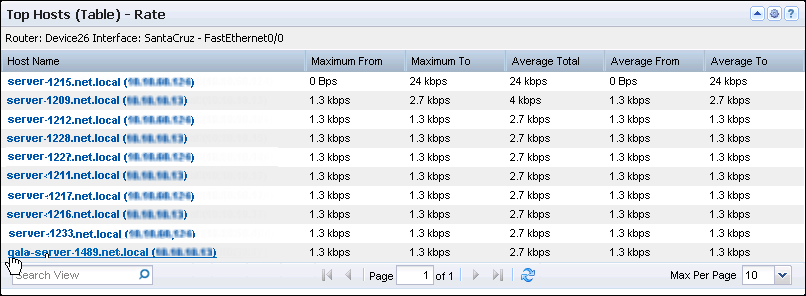
The view contains an interface identification string and a table. The table contains a row for each host with the fully qualified DNS host name (if available) and IP address, as well as the following rate, volume, or utilization information (by default):
The rate is calculated by dividing the data volume by the elapsed transmission time.
The utilization percentage is calculated by dividing the data rate by the data speed.
Performance Center views show the data from the time range that is defined for the page.
Opening the View
To see this view in the Performance Center Console, go to one of the following locations:
Available Actions
You can perform several actions in this view, including the following ones:
Find Host Tables in the NFA Console
You can display tables with host volumes in the NFA console for a selected interface:
View: Host Summary Table for the Top N Hosts.
View: Protocol Host Summary Table for the single protocol.
View: ToS Hosts Summary Table for the single ToS.
To display Flow Forensics-level detail, click the Flow Forensics link and run a Flow Forensics report.
|
Copyright © 2014 CA.
All rights reserved.
|
|