

Interface Reports › Interface Report Types › Growth Report
Growth Report
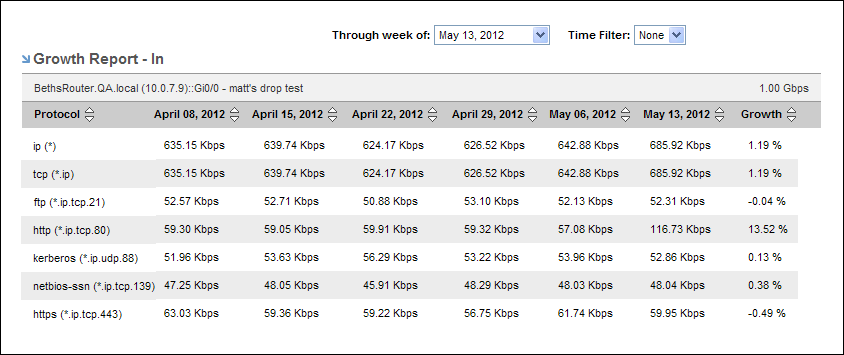
A Growth report provides historical growth statistics for the top protocols on the selected interface. This report helps you identify applications that consume increasing amounts of bandwidth over time and, in turn, determine whether the growth might ultimately require additional capacity.
To display a Growth report, start from an interface report.
Follow these steps:
- Display an interface report in either of the following ways:
- Locate and click an interface on the Interfaces page.
- Click an interface link in an existing view--for example, on the Enterprise Overview page.
- Select Growth Report from the report type menu at the top-left corner of the page.
The report page is updated to show a Growth Report table.
- (Optional) Choose the direction of the traffic to display by using the Presentation options.
- Direction In: Show traffic that is inbound to the interface.
- Direction Out: Show traffic that is outbound from the interface.
The currently selected option is highlighted and is marked with a blue arrow.
- (Optional) Change the reporting time period:
- Select Last 6 Weeks (default setting) or Last 6 Months in the Presentation options.
- Last 6 Weeks: Sets the report to show six weeks of data. The six most recent weeks are selected by default.
- Last 6 Months: Sets the report to show six months of data. The six most recent months are selected by default.
- (Optional) Use the ‘Through week of’ or the 'Through month of' option to select an alternative ending week or month for the six-week or six-month time period.
- (Optional) Restrict the reporting range by selecting a time filter from the Time Filter option list.
Time filters are created by the Administrator for CA Network Flow Analysis. For example, the Administrator could create a time filter to restrict the report data to business hours and business days. If the Time Filter list is empty, your Administrator has not created any time filters.
Also See: Change the time period for gathering report data.
Copyright © 2013 CA.
All rights reserved.
|
|