

The trend chart presentation format is available for interface data that is filtered by Protocol, ToS, Hosts, and Conversations. When you choose the trend chart presentation for a Protocol Summary, trend plots are shown for each of the top protocols.
Use trend charts to see traffic spikes and dips and to determine whether those patterns are consistent with your expectations for the interface. Click the name of a protocol, host, or conversation to view a more detailed trend chart.
By default, views and reports show the most recent 24 hours of data. To change the time period or apply a time filter, use the Timeframe options.
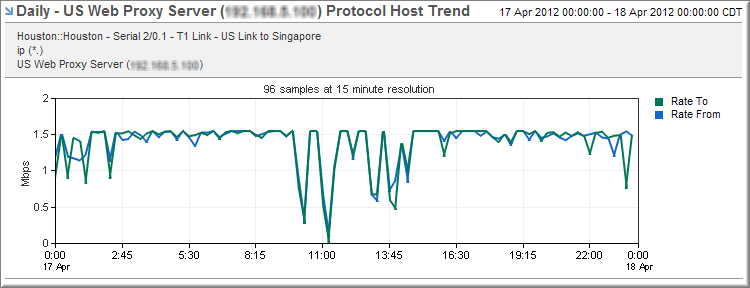
The preceding example shows a trend chart on the Interfaces page with the following settings:
Baselines
Protocol data views also support baselines for trend plots of some protocol, ToS and flow views. To display baselines, choose from the following settings:
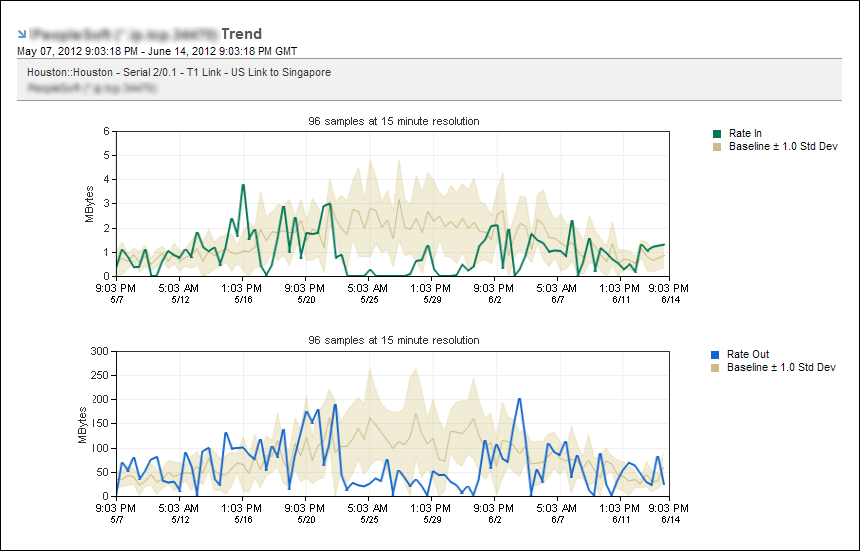
The preceding example shows trend plots on the Interfaces page with the following settings:
|
Copyright © 2013 CA.
All rights reserved.
|
|