

|
|
|
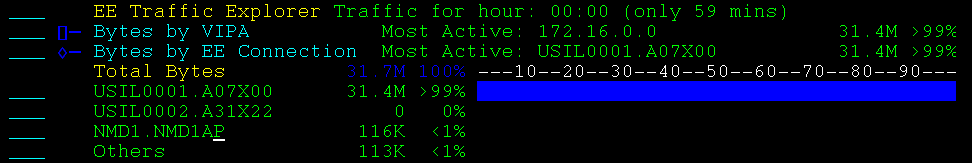
The EE Traffic Explorer uses data collected from the Packet Analyzer to graph EE traffic throughput.
You can use the TIME command to graph traffic for the following time frames:
The relative size of each bar in the graphs indicates a proportion or percentage of all cumulative traffic.
You can perform various functions from the EE Traffic Explorer, for example:
Example: Bytes by EE Connection
This example shows an expanded display listing the remote CP names that identify the connections.
| Copyright © 2012 CA. All rights reserved. |
|