

Use the Analysis menu for viewing, creating, and modifying analyses. The menu is visible by default in the Analysis pane of the Analysis page. You can hide it to expand the available viewing area for charts and tables.
Click the << or >> symbol (labeled Analysis Menu) to hide or display the Analysis pane.
Within the Analysis pane, the active analysis is highlighted in blue with white text. The active analysis and its filters are applied to the report that is visible in the Display area.
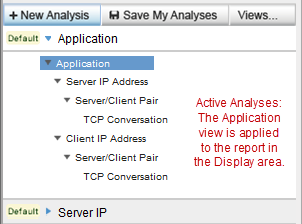
Child views of the active analysis are available to report increasing levels of detail, down to the TCP conversation level in some analyses. Their associated filters are designed to include or exclude specific sessions in the metrics shown in the Display area.
Expand an analysis to see the associated views. Click the blue arrow next to the analysis name to expand or collapse it. Collapsing or expanding an active analysis does not remove or add filters.
You can apply another view to the current time frame to look at the data in a different context. To apply another analysis, expand it in the Analysis pane, and then click an associated view.
|
Copyright © 2015 CA Technologies.
All rights reserved.
|
|