

PAD Code View editors are visual components in the Diagram Trace Utility main window. The main menu bar and toolbar on the Diagram Trace window contain operations that are applicable to the active PAD Code View editor.
You can start an editor inside the PAD Code view area of the Diagram Trace Utility main window to view CA Gen PAD code received from the application being debugged. Any number of PAD Code View editors can be open at one time, but only one editor can be active at any given time.
Important! The PAD Code View editors in the Diagram Trace Utility are read-only viewers. You cannot modify the PAD code in these editors. You must make any modification to the model using the CA Gen Toolset.
Tabs in the PAD Code View editor area indicate the names of resources that are currently open for viewing. By default, editors are stacked in the PAD Code View editor area, but you can tile them to view Action Diagrams simultaneously. You can also minimize and maximize PAD Code View editors to increase or reduce the amount of window space they occupy.
The following illustration shows an example of a PAD Code View editor view.
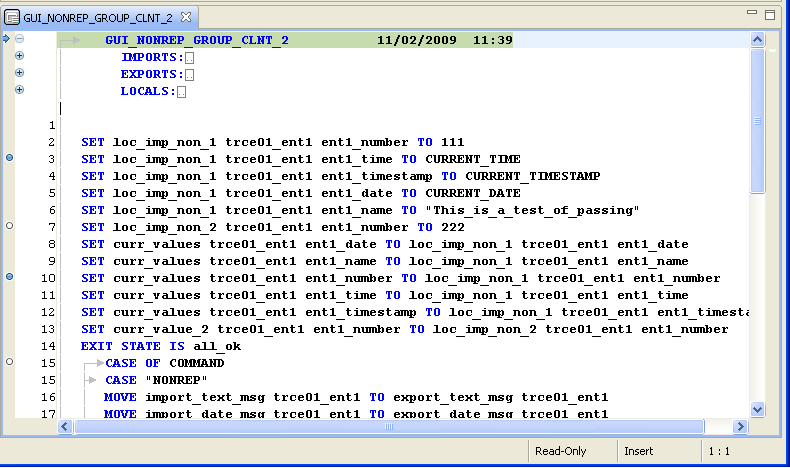
If you have set one or more breakpoints for tracing the program, they are displayed as blue or white circles on the highlighted border at the left margin of the PAD Code View editor. Blue circles indicate enabled breakpoints and white circles indicate disabled breakpoints.
|
Copyright © 2013 CA.
All rights reserved.
|
|