

The following illustration is an example of a default perspective (window layout).
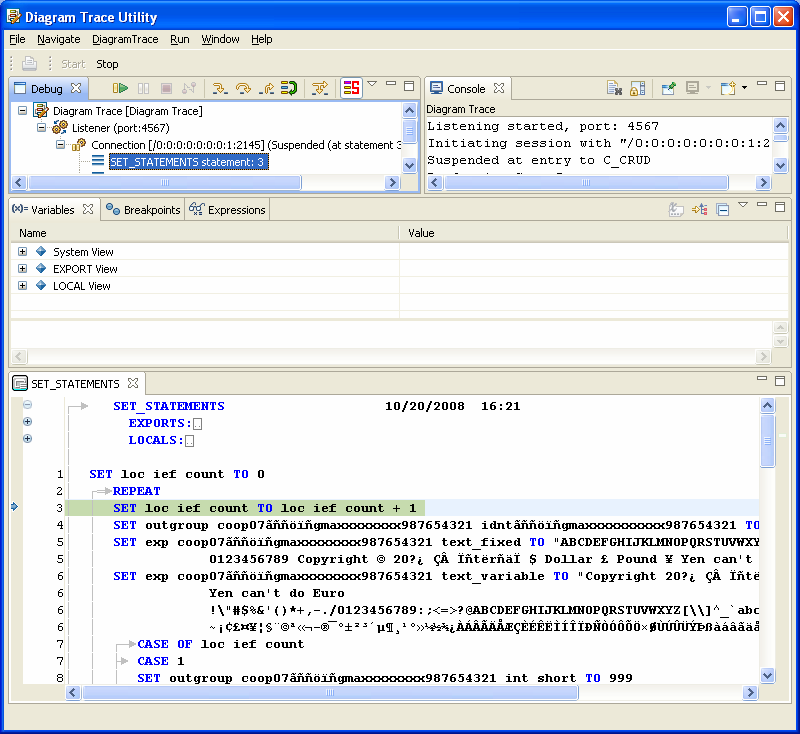
The Diagram Trace Utility is preconfigured to start a debugging session automatically when you start the software. The first time you start the Diagram Trace Utility, it displays the default perspective, which contains the Debug view, Console view, Variables view, Breakpoints view, Expressions view, and the PAD Code View editor. You can change the default window layout to suit your needs.
Note: The first time you start the Diagram Trace Utility, the views contain no data, except for the Debug view and the Console view. The Debug view contains a Diagram Trace Listener process that listens on the default port for new application connections. The Console view contains information about the session initiation and shows the port on which the Listener process is listening for connections.
|
Copyright © 2013 CA.
All rights reserved.
|
|