
You produce a single list of problems associated with each system based on all the comments received from the survey and from other information gathering activities.
Associate the problems, if possible, with each of the selected assessment criteria.
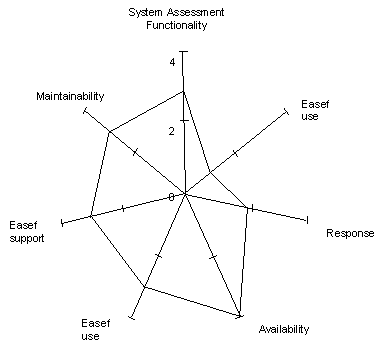
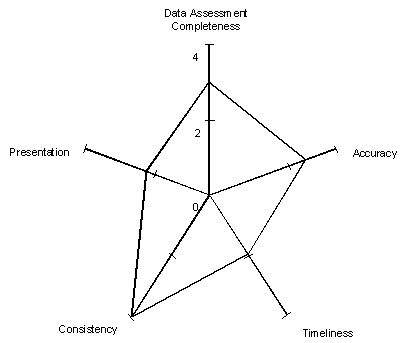
The average of all responses can be conveniently summarized as a chart. Low scores indicate problems that should be addressed in future solutions. The following illustrations are presented as radar, or footprint diagrams, for a system that adequately meets user requirements, but whose interface could be improved, as suggested by the low scores for "system ease of use" and "data presentation."
The following shows an assessment of a Current System.

The following shows an assessment of Current Data.

|
Copyright © 2014 CA.
All rights reserved.
|
|