

If you swipe the top left-hand section you can toggle between current value, absolute change, or percentage change. The ability to switch between values is also available on any status widget on the dashboard.
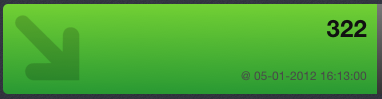
Displays the current value.
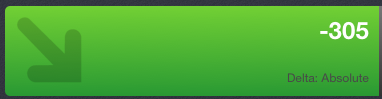
Displays the absolute change value from the last value read.
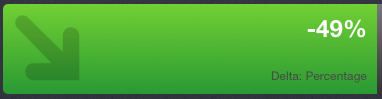
Displays the percentage change from the last value read.
If you swipe on the chart you will get a value indicator which appears on top of the chart with a line to indicate the value where the line is in the data.
If you touch and hold on the chart you will go into zoom mode, which allows you to zoom and scroll the chart. To get out of zoom mode touch and hold on the chart again.
On most devices, zooming can be performed with a pinching gesture. Once zoomed in you can drag the chart left or right in order to pan.
On certain devices, both actions are controlled by a dragging gesture, with a button appearing on the bottom toolbar to toggle between the two actions.
 Denotes that you currently can drag to zoom in and out the chart.
![]() Denotes that you can currently can drag to pan the chart left and right.
Denotes that you can currently can drag to pan the chart left and right.
|
Copyright © 2013 CA.
All rights reserved.
|
|