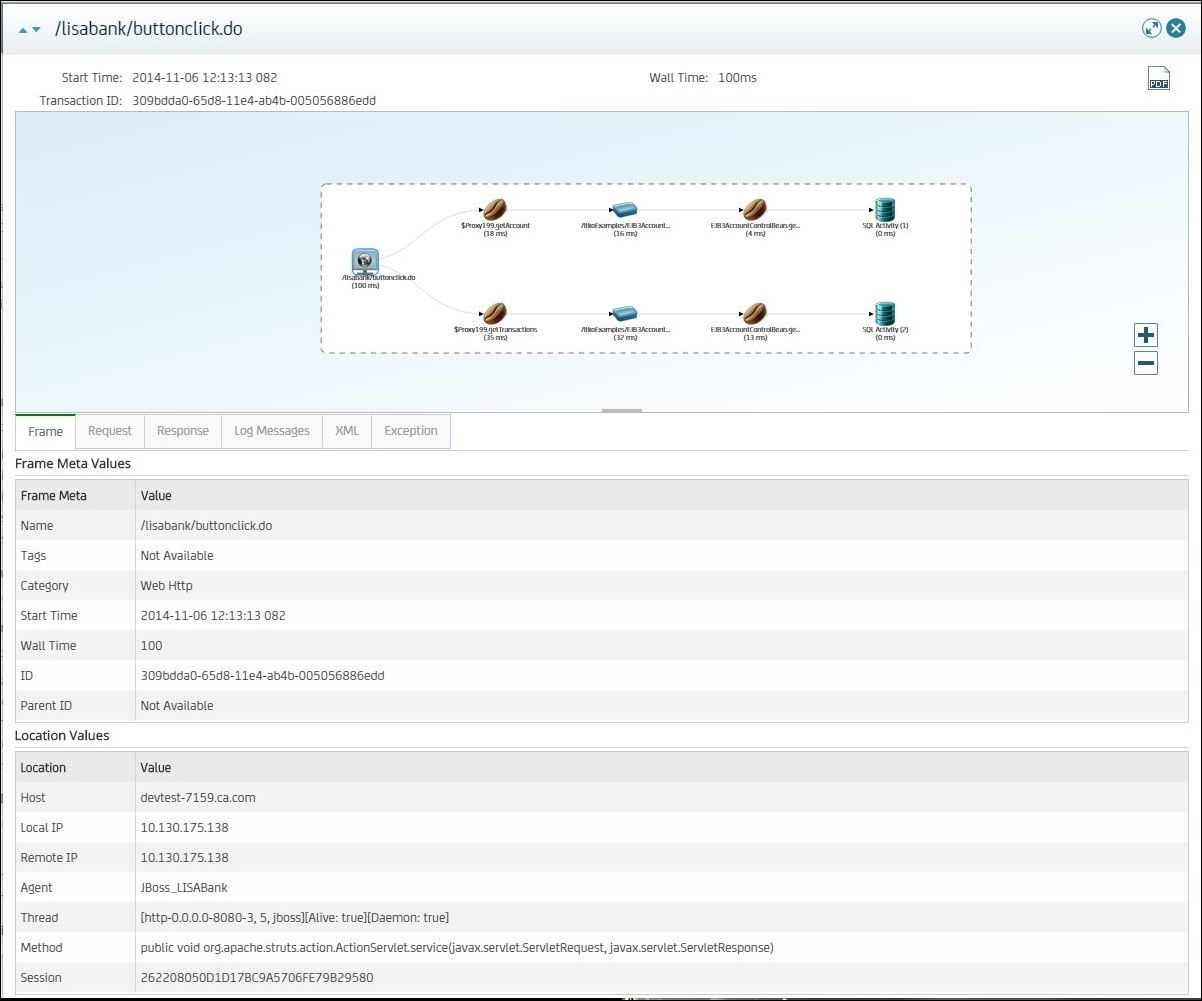

The transaction detail dialog contains information about each transaction in a path. The dialog is divided into the following areas:
The following graphic shows the transaction detail dialog:

Path Graph Information
The path graph displays the path and its frames in a graphical representation.
In the path graph, you can do the following operations:
The name of the agent that generated the path.
The date and time when the frame began running.
The execution time for the frame.
The unique identifier of the path.
Frame Information
The frame information displays the details of the selected frame in the path graph.
The frame information which includes meta and location values.
Any frame tags that the frame has.
The actual request that the selected frame sent. This information does not appear for JDBC frames.
The actual response that the selected frame received. This information does not appear for JDBC frames.
Information about the SQL call. This information includes the SQL statement, the results, and the output. This information appears only for JDBC frames.
The name of the thread on which the frame ran.
The amount of time that the processor spent running the frame.
The percentage of thread utilization.
Any log messages. By default, the minimum level of log messages is Warning. To change the minimum level, configure the Java logging level property.
You can configure this property from the Agents window of the DevTest Portal. The property appears in the Settings tab.
The raw XML of the instrumentation response in the frame. This information does not appear for JDBC frames.
Displays detailed information when a transaction contains an exception.
Follow these steps:
The Analyze Transactions window displays.
The transaction detail dialog opens. The title bar contains the full name of the frame.
|
Copyright © 2014 CA Technologies.
All rights reserved.
|
|