

The registry details window in the Enterprise Dashboard lets you view details about registries.
Note: This window only displays data for registries running version 7.5 or later.
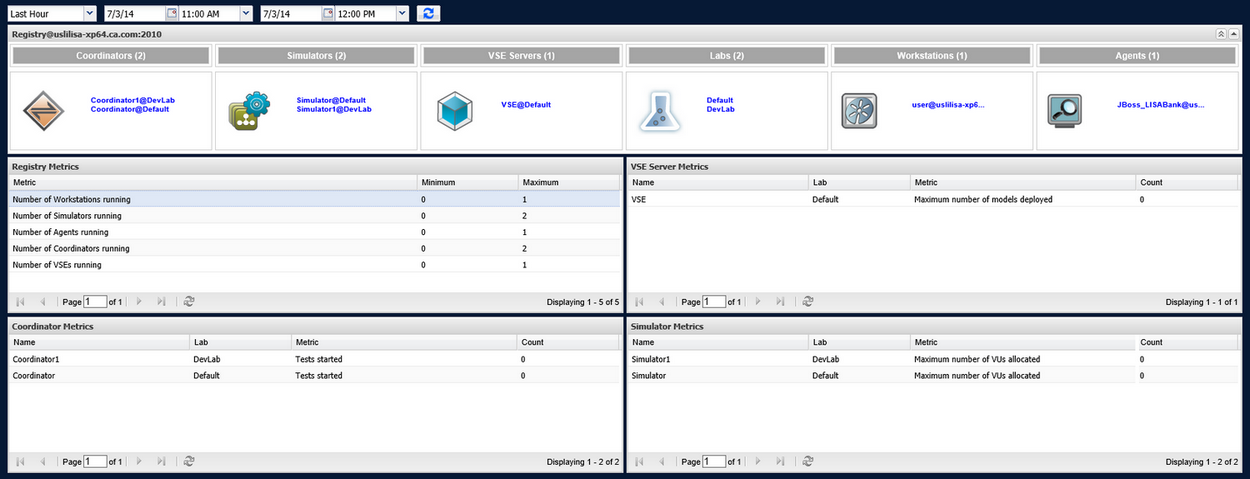
The top part of the window lists all active coordinators, simulators, VSE servers, labs, Workstations, and agents for the registry.
To designate the timeframe to use in displaying metrics, use the drop-down fields at the upper left of the panel. The first drop-down field provides a list of standard timeframes. To be more specific, specify a start date and start time and end date and end time in the other drop-down fields. Click the Refresh icon to refresh the display.
If the Enterprise Dashboard has been idle for some time, click Refresh ![]() to refresh the data for each panel.
to refresh the data for each panel.
The bottom part of the window shows metrics for registries, VSE servers, coordinators, and simulators.
The Registry Metrics area of the panel shows the largest and smallest number of workstations, simulators, coordinators, and VSEs running in the designated time period.
The VSE Server Metrics area of the panel shows the number of transactions and the number of labs that were deployed for each VSE active during the designated time period.
The Coordinator Metrics area of the panel shows the number of tests that were started for each coordinator during the designated time period.
If you run a test suite and the Enterprise Dashboard "tests started" count is not what you expect, see the suite results section of DevTest Workstation. Check the results for each failed test. If any tests failed to stage, the tests started count does not include them.
The Simulator Metrics area of the panel shows the maximum number of virtual users active during the designated time period.
To return to the main window, click Go back to registry view ![]() or click Overview in the breadcrumbs in the top left corner of the page.
or click Overview in the breadcrumbs in the top left corner of the page.
|
Copyright © 2014 CA Technologies.
All rights reserved.
|
|