

TIBCO Monitor Recorder
With every queue on a TIBCO EMS server, a user with administrator privileges can connect to a special monitor topic. While subscribed to this monitor topic, an administrator can receive a copy of every message that is sent over the corresponding queue. This feature allows the VSE recorder to be outside of the message flow of the application entirely and simply monitor the message traffic.
The following graphic shows the main components of TIBCO Monitor recording:
The message-oriented middleware (MOM) is the platform on which messages are exchanged.
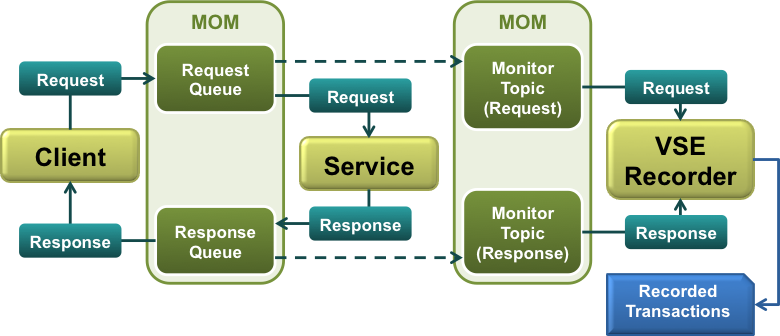
The TIBCO monitor topic that is associated with the request queue for the application. The TIBCO server forwards each message that is sent on the request queue to this topic automatically.
The TIBCO monitor topic that is associated with the response queue for the application. The TIBCO server forwards each message that is sent on the response queue to this topic automatically.
The TIBCO Monitor Recorder supports TIBCO EMS 6.3.
You cannot use monitor topics during playback to virtualize the service. You can do either of the following actions:
In the JMS connection asset, the admin user must have administrative privileges.
Follow these steps:
The proxy recorder setup page opens.
The proxy recorder setup page includes basic and advanced parameters. To display the advanced parameters, click PRO at the top of the editor.
The recording feedback page opens.
The table in the Summary tab contains a list of each request channel and response channel. Each row includes the channel name, the selected destination asset, the number of messages that have flowed through the channel, and the status.
The service image and the virtual service model are created.
|
Copyright © 2014 CA Technologies.
All rights reserved.
|
|