

This topic contains the detailed instructions for recording a virtual service image using the JDBC (Driver Based) transport protocol.
Note: The JDBC (Driver Based) transport protocol is scheduled for end of life in a future release. This functionality is replaced by agent-based JDBC virtualization.
For more information about prerequisites and preparatory steps, see Preparing to Virtualize JDBC.
Follow these steps:
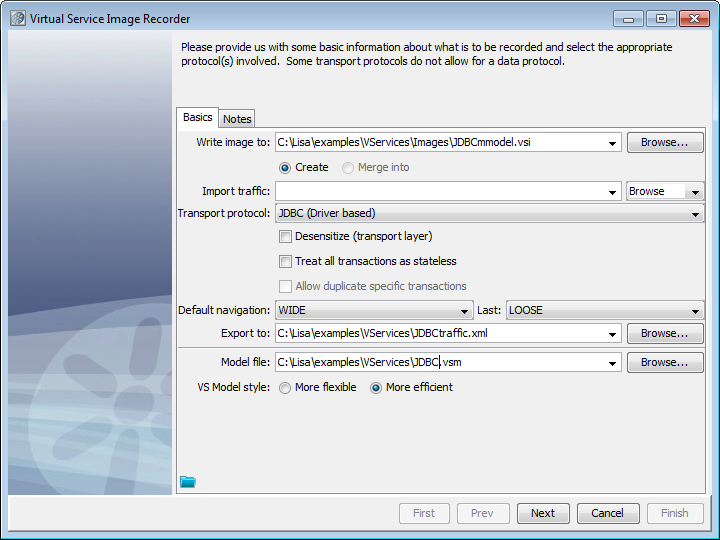
The Virtual Service Image Recorder opens.
The endpoint configuration window opens.
JDBC VSE supports multiple endpoints during recording and playback. In the recorder and the JDBC listen step editor, there is a table of Driver Host, Base Port, and Max Port. When Base Port and Max Port differ, a unique endpoint is created for the base port and the max port and each port between.
To stop trying to connect, click Cancel in the status window.
The SQL Activity tab shows the ten most recent statements executed (and how many times they ran) for every unique connection URL and database user combination. This display refreshes approximately every five seconds.
The Loaded Drivers tab lists the JDBC drivers that are installed and registered in the system under test.
Lists the URLs added from the SQL Activity list or the URL/User entry fields. To delete an entry, select it and click Remove.
An unnamed area below the URLs to Record field where you can include a database user with the URL. If you leave this field blank, the recording applies to all users connecting to the URL.
Note: To enable the Add button, supply a connection URL in the first field and a user name in the next field.
The bottom section shows the list of connection URL and database user combinations that are recorded. The URL can be a regular expression. This list is typically initially empty unless the state attribute is set to RECORD on a simulation connection URL for DataSource style systems under test.
If a driver is selected from the drivers list, you can use the To URL button to copy a generic regular expression that matches the connection URLs for that driver to the URL entry field. If the connection URL (top level) node in the activity tree is selected, you can use the To URL button to copy the URL and user to the URL and user entry fields. Also, to add the connection URL and user directly to the recording list, use the Add button to the right of the activity tree.
Connection URLs can be either exact or a regular expression that matches connection requests and can be added to the recording list with or without a database user. The absence of a database user matches any user attempting to connect. If the Add button to the right of the URL and user fields is disabled, the recording list probably already covers the URL and user combination.
The Recording has begun window opens.
The options and dynamic display statistics include:
Displays the number of conversations recorded.
Displays the number of transactions recorded.
Clears the list of currently recorded transactions.
The number of Total conversations and Total transactions increases with the number of transactions recorded.
Note: If no transactions are recorded, you could have a port conflict. The client sends transactions to the application instead of the Virtual Service Recorder. If another service is using that port, either stop that service or change the port setting so there is no longer a conflict.
If you have performance issues, it is possible that the target database is responding slowly. Check the user.home\lisatmp\tmanager.log file for debug messages that report the query execution time.
For example:
2009-07-01 15:35:39,248 [AWT-EventQueue-0] DEBUG com.itko.lisa.vse.stateful.model.SqlTimer - Exec time 72ms : SELECT TRAFFIC_ID, LAST_MODIFIED, SERVICE_INFO, CREATED_ON, NOTES, UNK_CONV_RESPONSE, UNK_STLS_RESPONSE FROM SVSE_TRAFFIC
If the query time exceeds a threshold, warning messages like the following are generated:
2009-07-01 15:17:11,161 [AWT-EventQueue-0] WARN com.itko.lisa.vse.stateful.model.SqlTimer - SQL query took a long time (112 ms) : SELECT TRAFFIC_ID, LAST_MODIFIED, SERVICE_INFO, CREATED_ON, NOTES, UNK_CONV_RESPONSE, UNK_STLS_RESPONSE FROM SVSE_TRAFFIC
The recorder prepares to write the .vsi file by verifying request and response bodies. The recorder ensures that, if they are marked as text, that they are text. If they are not text, the type is switched to binary.
The recorder finishes postprocessing the recording.
Note: To save the settings on this recording to load into another service image recording, click Save ![]() above the Finish button.
above the Finish button.
|
Copyright © 2014 CA Technologies.
All rights reserved.
|
|