

The JMX metrics use the Java Management Extension (JMX) API to provide metrics.
These JMX connectors are provided for an easy setup:
Each of these applications requires slightly different connection parameters. The values that you require for your server are available from your server administrator. Each provider provides slightly different metrics. To use other JMX features, you can invoke them as RMI steps.
Only numerical attributes are supported.
The following example uses JBoss.
Follow these steps:
The Select and Configure JMX Agent dialog opens.
The JMX Object Attribute Viewer opens.
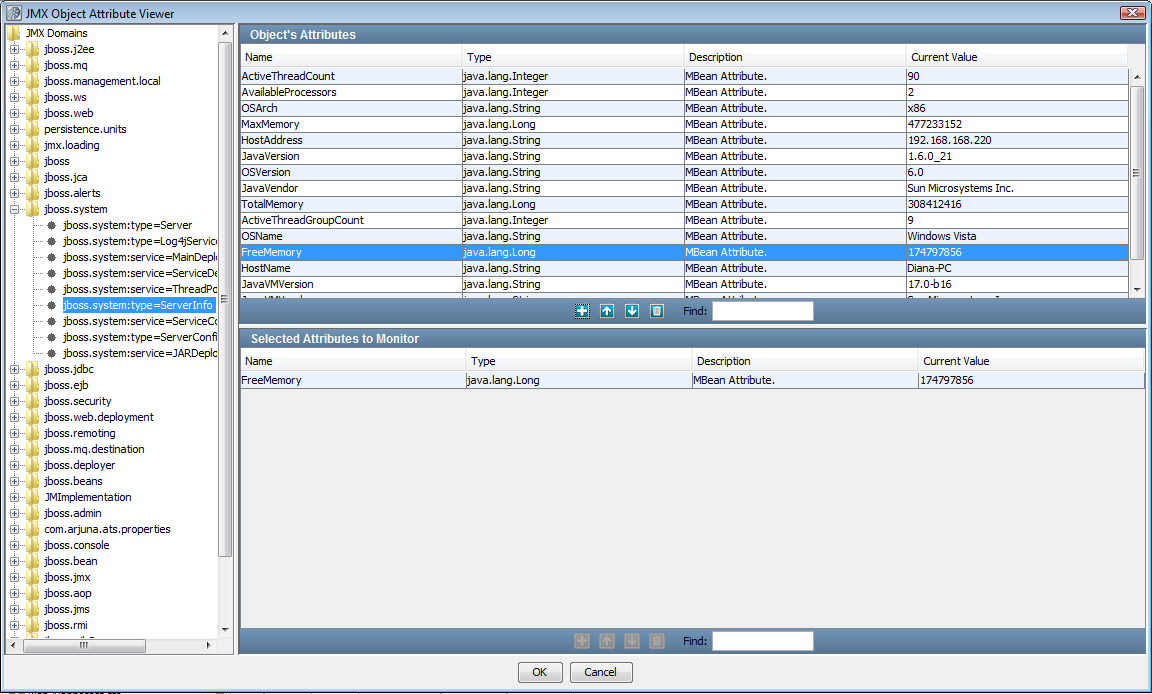
On the left is the JMX Domain hierarchy for JBoss. JMX metrics use an object-attribute model. In this model, domain objects are published by the specific application server (for example, "system"), and attributes are name/value pairs inside the object.
When you select an object from this tree, then the base attributes of that object are also displayed in the tree. After you select a base attribute, the rest of the attribute name appears in the list in the top right Object Attribute panel.
In the previous example, we selected the domain object to be jboss.system, the base attribute to be ServerInfo, and the rest of the attribute name to be FreeMemory. The attributes for ServerInfo are displayed in the Object Attribute panel.
This metric is added to the list of selected metrics in the Selected Attributes to Monitor panel at the bottom of the window.
To remove an attribute from this panel, click Delete ![]() .
.
Notice that the JMX metrics are now on the list of metrics.
Depending on the application server, vendor-specific JARs could be required to enable the JMX communication with that application server.
|
Copyright © 2014 CA Technologies.
All rights reserved.
|
|