

Before LISA 6.0.6, the response time for an inbound request came from the think time specification on the specific response that was determined for that request. Sometimes, primarily during load and performance testing scenarios, the response times should be modeled after the times from a live system. For example, a live system can show a drop in performance equivalent to twice the nominal response times during peak load. In this case, it is helpful to have VSE emulate this response time curve. It is also helpful to let VSE cover (or play back) this curve over an arbitrary interval to allow, for example, a 12-hour period of observed response time metrics to be played out over a 3-hour test.
The VSE Observed System companion supports these requirements. If a virtual service will provide this behavior, add and configure this companion.
Configuration Information
The Observed System companion requires the following parameters:
Defines a time "window" in which to read observed response times. These timestamps are inclusive. Timestamp data from your data set or data provider that is outside this window is ignored.
Defines a duration that represents the interval over which the virtual service "fits" the response time curve. For the previous example, this value would be set to three hours.
For example, with the following values:
we get the buffer for the first 10 minutes, then for 10-20 minutes, then for 20-30 minutes, then 45-60 minutes.
With the following values:
The first 10 minutes plays back in the first 5 minutes, the second 10 minutes plays back in the second 5 minutes, and the third 10 minutes plays back in the third 5 minutes.
Defines a duration in minutes and can be used to control how much of the response time data is acquired at once. The parameter defaults to one hour of data at a time.
For example, an assumed run length of 1 hour and a buffer size of 15 minutes provides the following results:
This parameter tells the companion where to get the data. We currently provide a DevTest data set data provider and a CA Application Performance Management (Wily) data provider.
Any data provider must provide three pieces of information:
The DevTest data set data provider requires that the data set provide this information in fields labeled "id", "timestamp" and "responseTime", respectively. The timestamp value, if not an actual Date object, must be a string in the form "yyyy-MM-dd HH:mm:ss.SSS". How the ID maps to any specified inbound request is data-provider specific. For the data set provider, it must match the operation of the request. The CA Application Performance Management (Wily) provider uses a regular expression-based approach.
Data Set Source Example
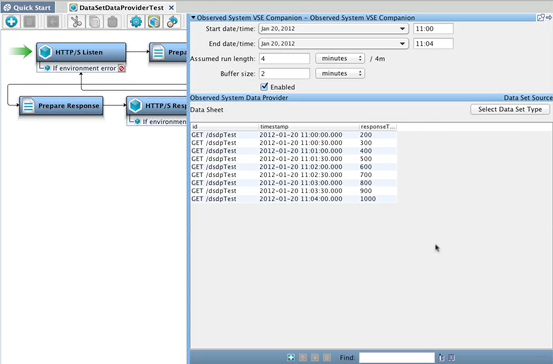
In this example, a data set provides the input for the Observed System VSE companion. The definition of the data that this companion provides lets you change the response time for a transaction, or for multiple transactions over time.
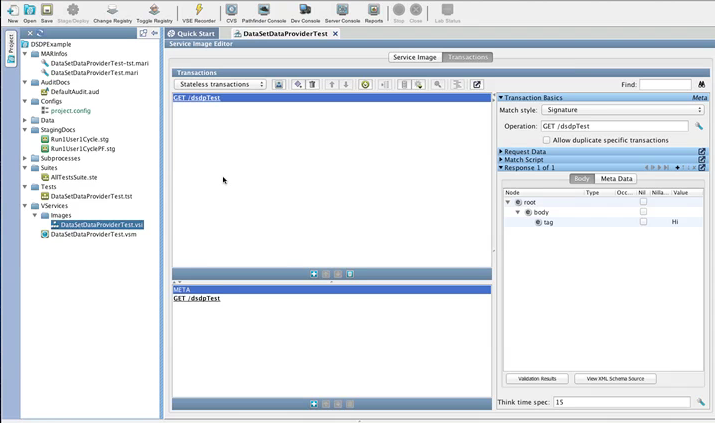
The service image that is shown contains one transaction, and the Think time spec is set to 15 milliseconds.
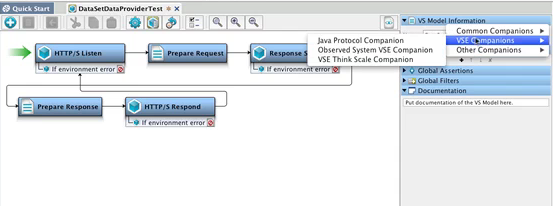
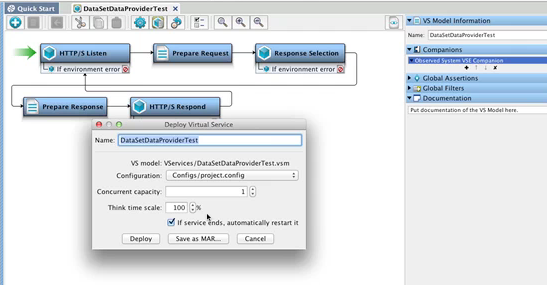
The virtual service model that is associated with this service image has a few simple steps.
The top part of the panel provides general information about the parameters for the companion.
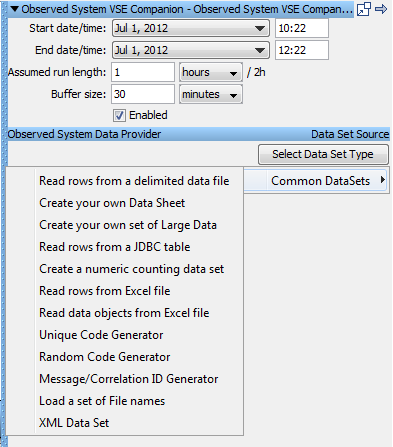
In this example, the Start date/time and End date/time define a two-hour window, but the Assumed run length is set to one hour. Therefore, for every one hour of VSE run time, the companion goes through two hours of data from the data set data provider. The buffer size of 30 minutes means that VSE accesses the data set every 30 minutes to retrieve data. The buffer size is before scaling. Therefore, with a 30-minute buffer:
To disable the companion temporarily, clear the Enabled check box.
Any data providers, including DevTest data sets and the Wily Observed System Data Provider, can back the Observed System Companion. Click (click here to select), select Data Set Source, and the Select Data Set Type button appears. Click Select Data Set Type, select Common DataSets, then select Create your own Data Sheet.
When the table for Create your own Data Sheet opens, the columns are prepopulated with:
Matched against the Operation Name when the request is being processed.
If the standardDeviation value is 0, the responseTime defines the interval to use during playback. Use the mathematical formula that is described for the standardDeviation column for non-zero values. This response time calculation overrides the think time spec of 15 milliseconds that was set in the service image.
Defines the statistical data that represents the standard deviation from the mean value of the response time. The response time that is used during playback is within +/- 3sigma of the average response time. If x is the responseTime and y is the standardDeviation, the response time during playback is a random value in the range (x -3 y) and (x +3 y).
These columns are required for any type of data set provider that you use to provide information for this companion.
In this example, copy the Operation Name of GET / dsdpTest from the service image and enter it in the id field. In the responseTime field, enter 150.
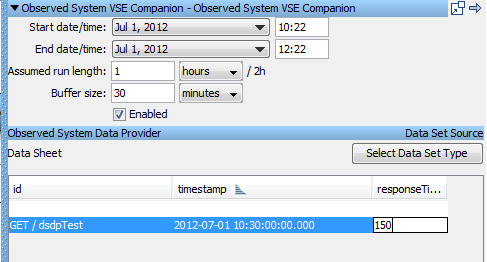
In the timestamp field, enter a date and time that falls into the time window that Start date/time and End date/time define.
To continue the example, we use an existing project with a prepopulated data set.
The data set response times define an increase of 100 milliseconds every 30 seconds. Therefore, this companion should always override the Think time spec of 15 milliseconds that is set in the virtual service model.
Note: When you deploy the virtual service, do not enter a Think time scale of 0 percent.
Observed System Data Provider (Wily) Source
The Observed System VSE Companion can also receive input from the CA Application Performance Management (Wily) application. To configure the companion to work with Wily, enter the configuration information in the top part of the panel. Then click (click here to select), and select Data Set Source of Wily Source.
Parameters for the Wily Observed System companion are:
Specifies the URL for the Wily web service.
Specifies a regular expression that identifies the agent.
Specifies a regular expression that identifies the metric. This metric RegEx is wrapped as the middle part of the metric RegEx that is sent to the Wily server. The metric RegEx sent to the server is:
".*WebServices\|Server\|<user entered pattern>:Average Response Time.*"
For example, if you want to query the metric:
"WebServices\|Server\|http_//ejb3\.examples\.itko\.com/\|(.*)Average Response Time \(ms\)"
you can input
"http_//ejb3\.examples\.itko\.com/"
This example fetches all the Average Response Time metrics for the web service. To retrieve the metrics for specific operations, use a custom RegEx.
Default: ".*"
Specifies the user name used to access the Wily service.
Specifies the password that is associated with the Service Username, if necessary.
To test the behavior of the companion, stage a quick test.
The test case in this example had one step, an output log message step. You can see the output in the Test Events tab of the Quick Stage Run window.
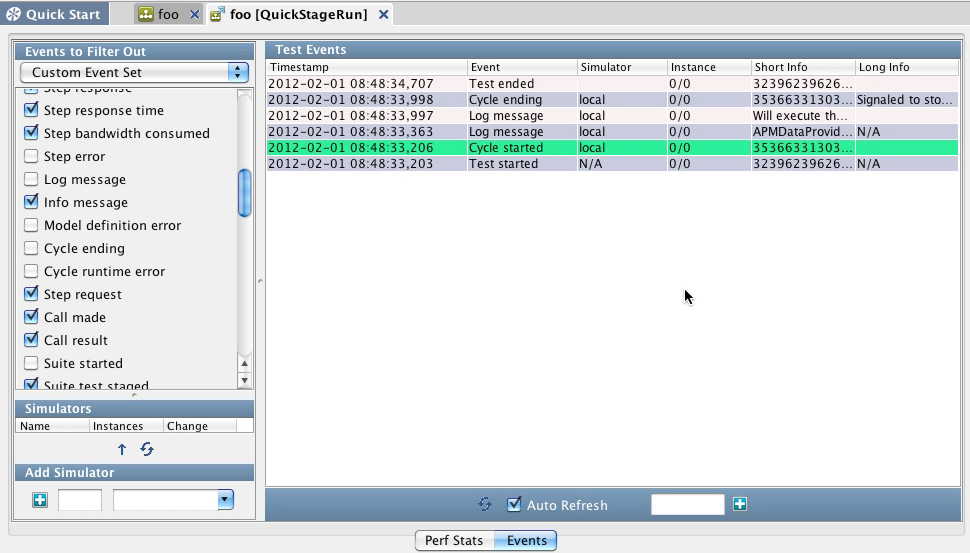
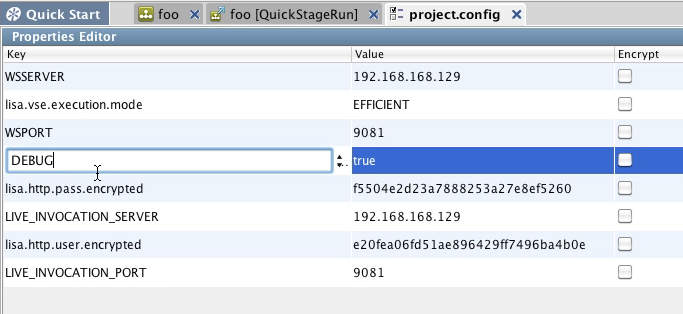
In the config file that is used for this test case, setting the property debug to true means that the log message appears in the output.
Run Time Priorities
The process that is followed at run time is:
For example, an assumed run length of 1 hour and a buffer size of 15 provides the following results:
|
Copyright © 2014 CA Technologies.
All rights reserved.
|
|