

The System(s) Under Test Overview gives a high-level overview of systems that are executing transactions that are sent from DevTest tests. Identifying the systems that DevTest is testing is difficult. You can edit the metric groupings to define which of the systems that Introscope instruments are also systems that DevTest is testing. By default, the grouping contains the demo server.
The System(s) Under Test dashboard displays metrics from systems under test by DevTest. To define which agents instrument systems under test, edit the Metric Grouping Agent Expression for all metric groups that are defined in the Management Module with names starting with "Systems Under Test". By default this expression is set to (.)|(.)|JBoss LISA Demo Server(.*), which selects the demo server.
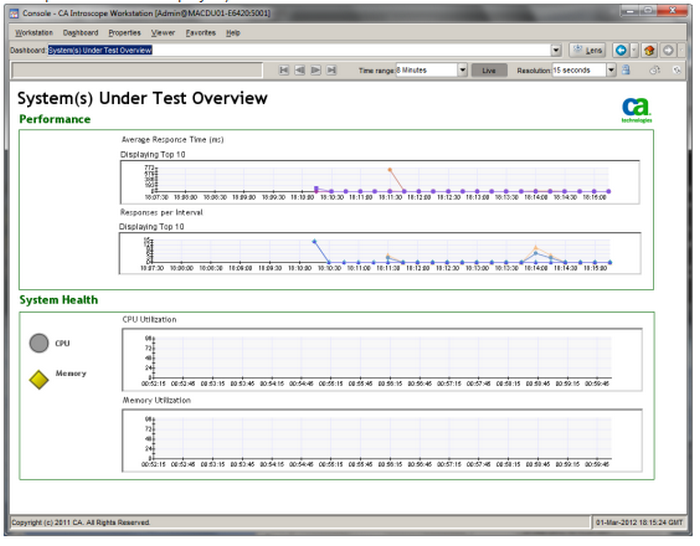
The dashboard is divided into two sections. The top section shows metrics on the top ten front-end Average Response Time (ms) and Responses Per Interval metrics from all application servers under test.
The bottom section shows CPU and memory utilization for all application servers under test. This section also contains two alert icons that indicate alerts relating to CPU and memory utilization.
|
Copyright © 2014 CA Technologies.
All rights reserved.
|
|