

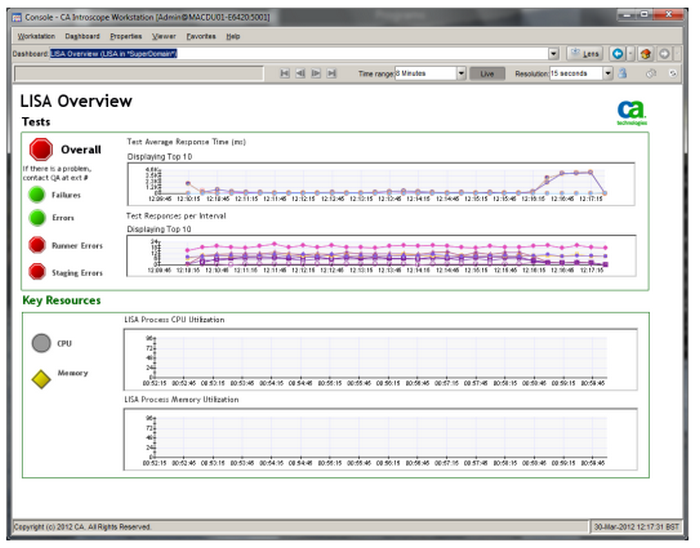
The Overview dashboard gives a high-level overview of all instrumented processes and of the tests being run in the DevTest installation.
The Tests section of the Overview dashboard includes four simple alert icons:
Set to caution if any test has reported a failure in the last reporting interval. Set to danger if any test has reported two or more failures in the last reporting interval.
Set to caution if any test has reported an error in the last reporting interval. Set to danger if any test has reported two or more errors in the last reporting interval.
Set to caution if the Test Runner Errors Per Interval metric has a value of 1 for any reporting interval. Set to danger if it has a value of 2 or higher for any reporting interval.
Set to caution if the Staging Errors Per Interval metric has a value of 1 for any reporting interval. Set to danger if it has a value of 2 or higher for any reporting interval.
This section also includes the following elements:
A summary alert that is set to caution if any of the preceding four alerts is set to caution. This alert is set to danger if any of the preceding three alerts is set to danger.
Shows up to ten Average Response Time (ms) metric graphs for test case, simulator, and test steps. The ten graphs that are chosen have the top ten metric values in the time period displayed.
Shows up to ten Responses Per Interval metrics graphs for test case, simulator, and test steps. The ten graphs that are chosen have the top ten metric values in the time period displayed.
Shows a graph of CPU:Utilization Percent (process) metrics for all instrumented processes.
Shows a graph of the GC Heap:Bytes In Use metrics for all instrumented processes.
The following graphic shows the LISA Overview Dashboard.
An alternate version of the Overview dashboard replaces the graphs in the top left panel with links to three new dashboards. These dashboards provide overviews of the following metrics:
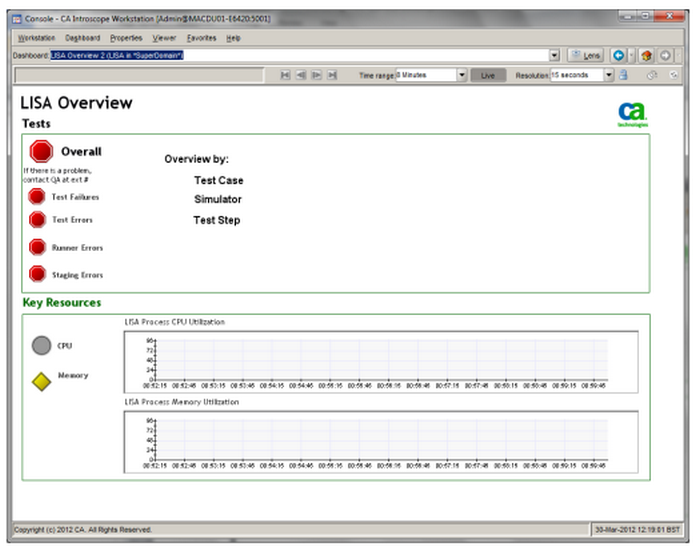
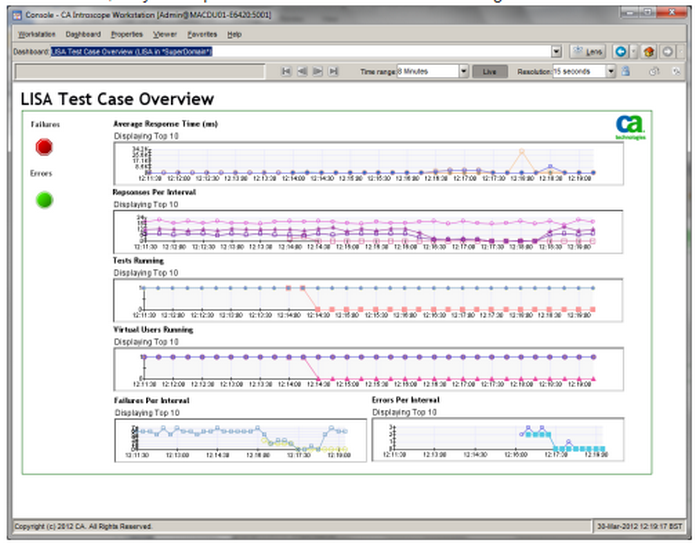
Test Case Overview Dashboard
The Test Case Overview dashboard shows graphs for the following metrics:
In each case, only the top ten metrics are shown.
Simulator Overview Dashboard
The Simulator Overview dashboard shows graphs for the following metrics:
In each case, only the top ten metrics are shown.

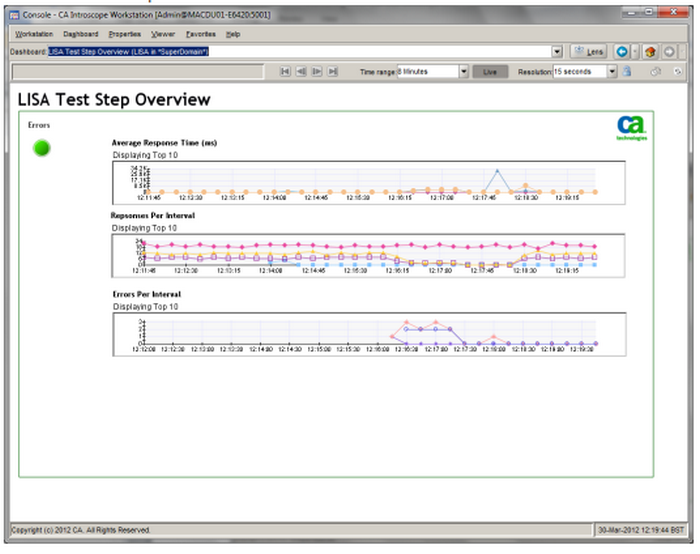
Test Step Overview Dashboard
The Test Step Overview dashboard shows graphs for the following metrics:
In each case, only the top ten metrics are shown.
|
Copyright © 2014 CA Technologies.
All rights reserved.
|
|